

Gold, Retail Trader Positioning, Technical Analysis – IGCS Update
- Gold prices fell the most in over one month
- Retail traders turned less bearish on Monday
- Does this bode ill for XAU/USD next?
Recommended by Daniel Dubrovsky
Get Your Free Gold Forecast
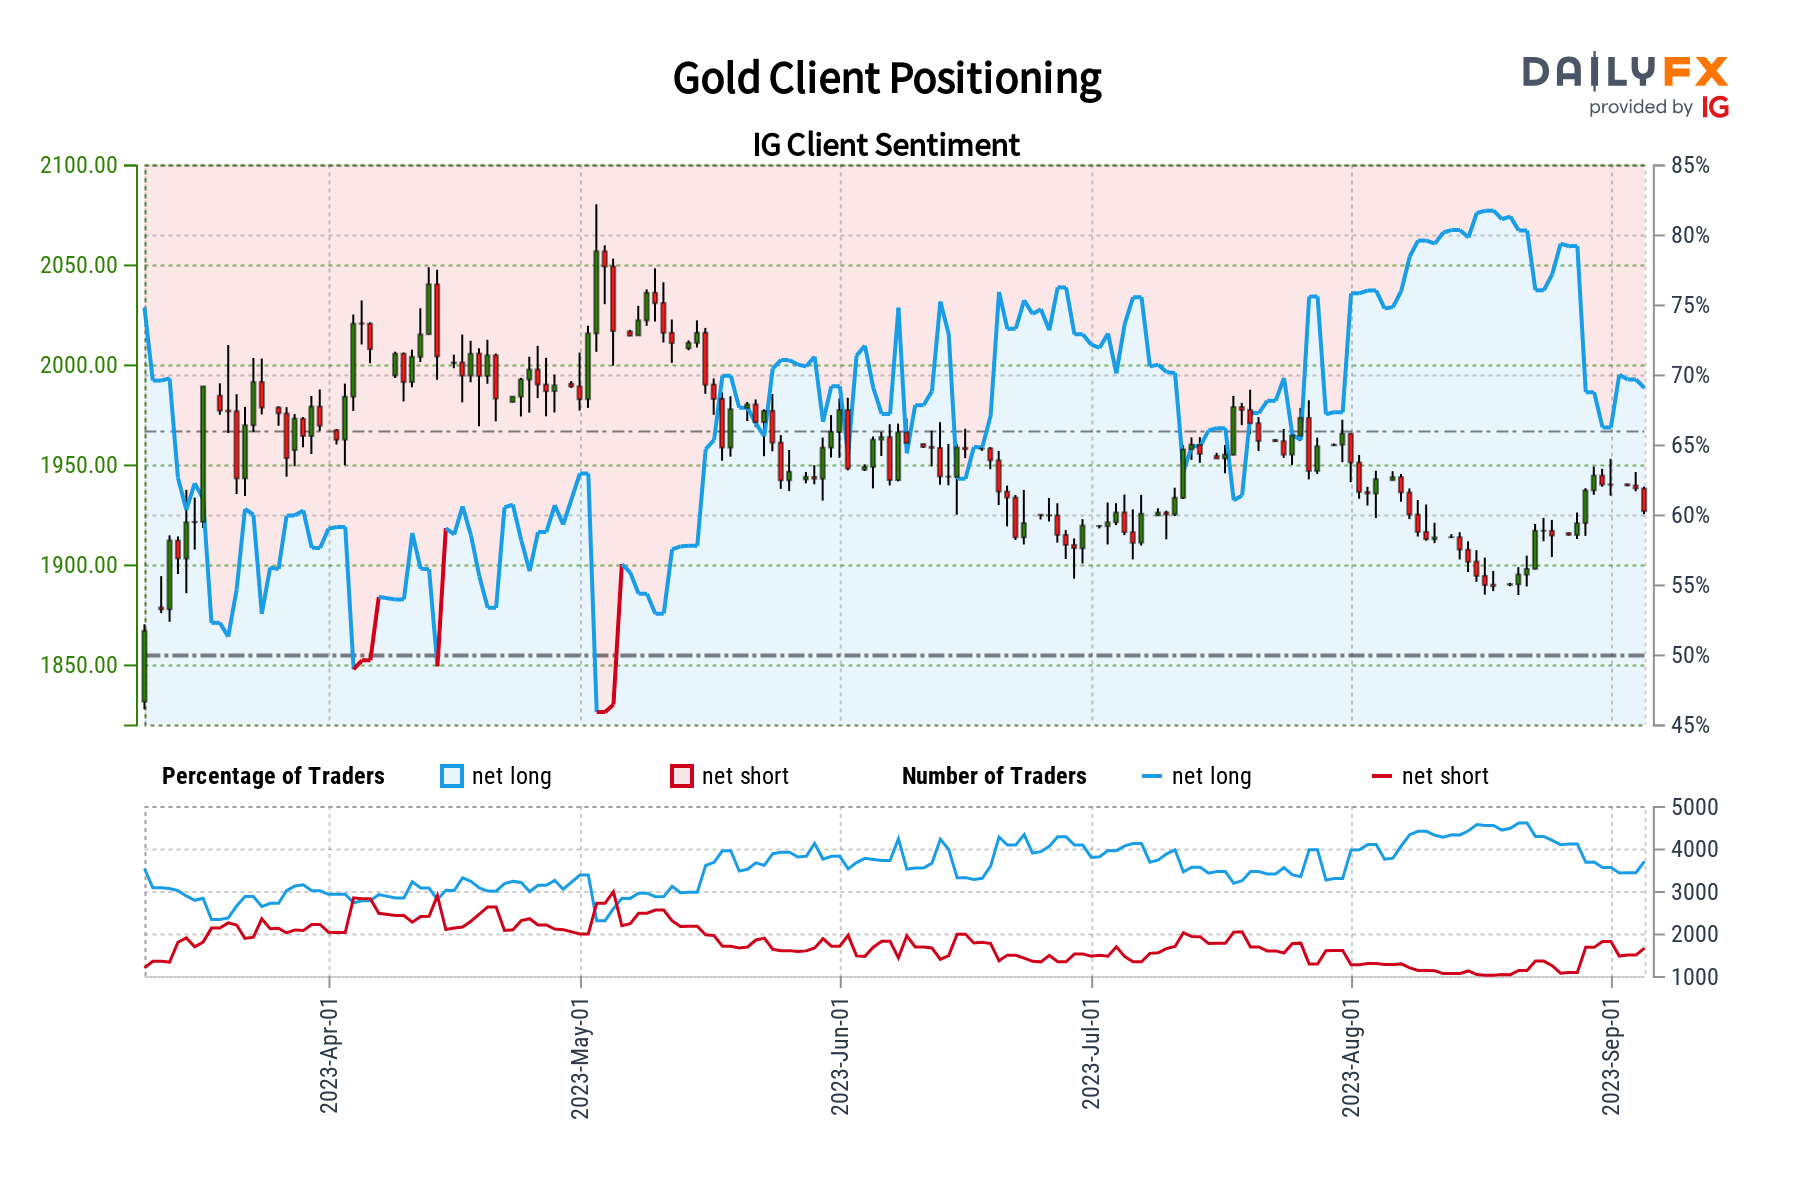
Gold prices fell almost 0.7 percent on Monday marking the worst 24-hour period in over one month. In response, retail traders decreased their downside exposure. This can be seen by taking a look at IG Client Sentiment (IGCS), which often functions as a contrarian indicator. With that in mind, could further pain be in store for the yellow metal?
Gold Sentiment Outlook – Bearish
The IGCS gauge shows that about 71% of retail traders are net-long gold. Since most of them remain biased higher, this hints that prices may continue lower down the road. This is as downside exposure decreased by 9.17% and 3.69% compared to yesterday and last week, respectively. With that in mind, the combination of overall exposure and recent changes produces a stronger bearish contrarian trading bias.
| Change in | Longs | Shorts | OI |
| Daily | 1% | -10% | -2% |
| Weekly | 1% | -12% | -3% |
XAU/USD Daily Chart
On the daily chart, the falling trendline from May maintained the downward technical bias since earlier this year. In fact, last week gold was at the crossroads of the falling trendline and former rising support from the end of last year. A rejection of both underscores the current downward trajectory, placing the focus on a potential retest of the August low at 1884.89.
Confirming a breakout under latter exposes the midpoint of the Fibonacci retracement level of 1848.37 and offering an increasingly stronger bearish technical bias. Otherwise, pushing above the trendline and confirming gains places the focus on the 23.6% level at 1971.63, opening the door to reversing the downtrend since earlier this year.
Recommended by Daniel Dubrovsky
How to Trade Gold
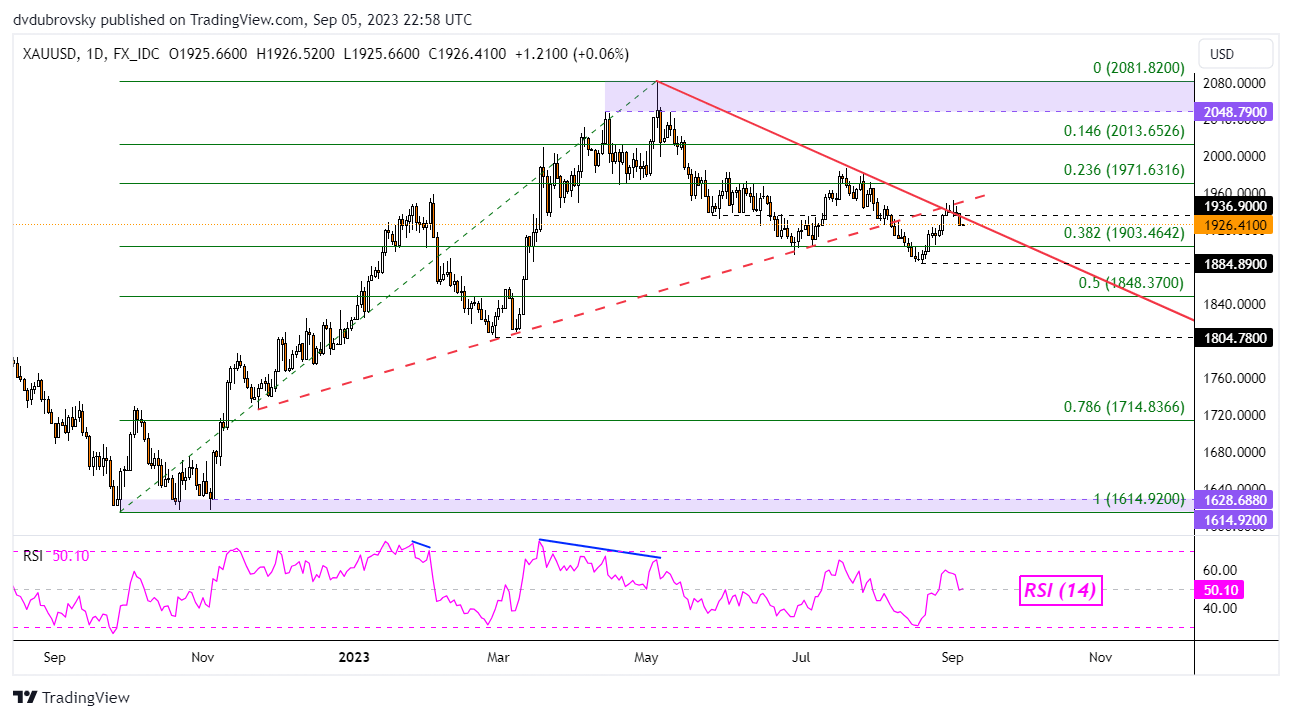
Chart Created in Trading View
— Written by Daniel Dubrovsky, Senior Strategist for DailyFX.com

 آموزش مجازی مدیریت عالی و حرفه ای کسب و کار DBA


ارسال نظر شما
مجموع نظرات : 0 در انتظار بررسی : 0 انتشار یافته : 0