

Canadian Dollar, USD/CAD, Hanging Man – Technical Update:
Recommended by Daniel Dubrovsky
Get Your Free USD Forecast
The Canadian Dollar has been losing ground to the US Dollar of late, but a closer look at USD/CAD shows that the near-term uptrend might be losing momentum. On the daily chart below, we can see that as prices climbed, negative RSI divergence started to emerge. This underscored fading momentum, which can at times precede a turn lower.
Furthermore, the exchange rate left behind a Hanging Man candlestick pattern. A confirmatory downside push could open the door to a bearish reversal. Such an outcome would place the focus on the 20-day Moving Average (MA). The latter could hold as support, reinstating the broader upside technical bias. Let us take a closer look at the 4-hour setting to see where near-term price action could go.
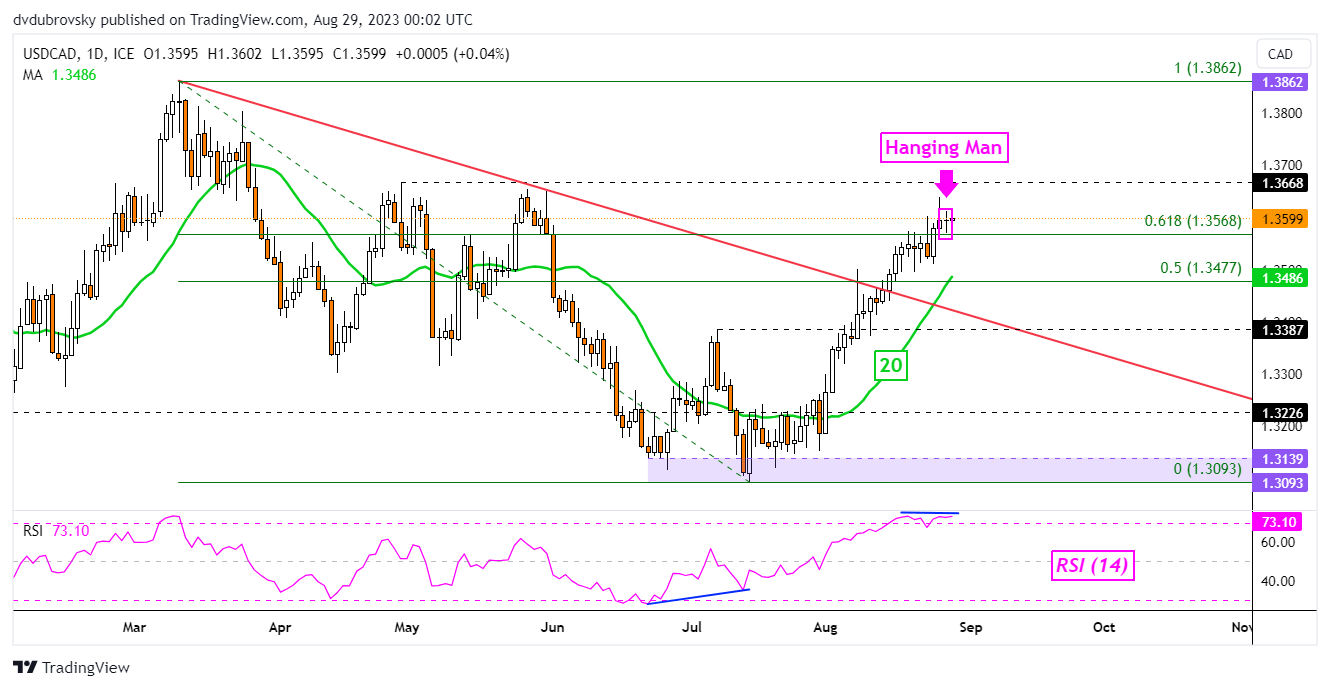
Chart Created in TradingView
On the 4-hour chart below, we can see that negative RSI divergence is more pronounced. This is as prices are about to test highs from May and June, making for a key zone of resistance around 1.3626 – 1.3667. A drop through the trendline places the focus on the 100-period Moving Average. The latter could hold as support, maintaining the near-term upside technical bias.
In the event of a turn lower, key support is the 1.3502 inflection point. Extending lower and through the moving average exposes the August 10th low of 1.3368. Beyond the latter sit the midpoint and 61.8% Fibonacci retracement levels of 1.3295 and 1.3246, respectively. Otherwise, pushing above the zone of resistance exposes the 78.6% and 100% Fibonacci extension levels at 1.3692 and 1.3781, respectively.
Recommended by Daniel Dubrovsky
The Fundamentals of Breakout Trading
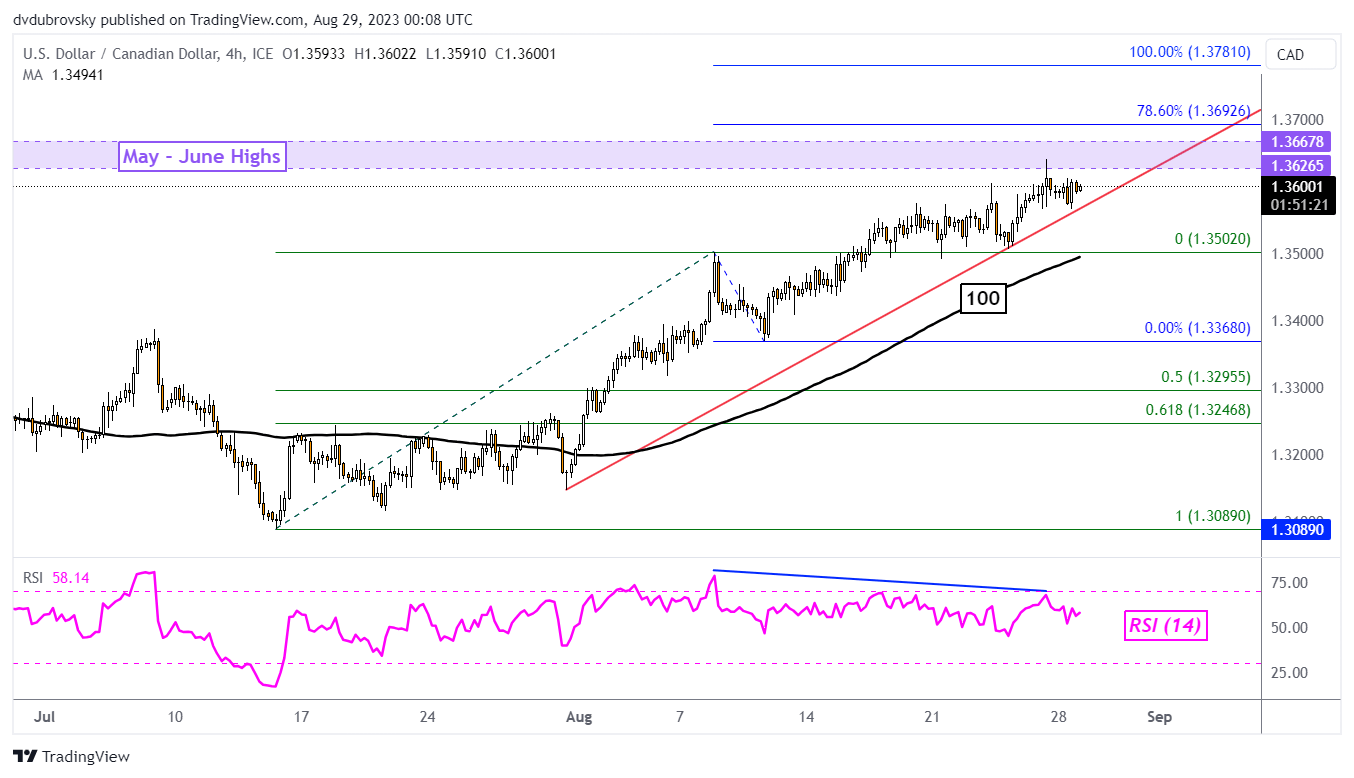
Chart Created in TradingView
— Written by Daniel Dubrovsky, Senior Strategist for DailyFX.com

 آموزش مجازی مدیریت عالی و حرفه ای کسب و کار DBA


ارسال نظر شما
مجموع نظرات : 0 در انتظار بررسی : 0 انتشار یافته : 0