

New Zealand Dollar, NZD/USD, CPI – Market Update:
Recommended by Daniel Dubrovsky
Get Your Free USD Forecast
The New Zealand Dollar cautiously weakened in the aftermath of local inflation data. During the third quarter, New Zealand’s Consumer Price Index (CPI) grew by 5.6% compared to a year ago. This was slower than the 5.9% anticipated outcome. Meanwhile, compared to the previous quarter, local headline inflation expanded by 1.8%. That was slightly lower than the 1.9% expected result.
The data resulted in a softer-than-expected inflation report, which has key implications for the Reserve Bank of New Zealand (RBNZ). The RBNZ sets monetary policy by adjusting interest rates to help influence the pace of inflation and economic growth. The CPI data could mean that the central bank approaches policy with slightly more caution than previously expected.
As a result, the data has cooled expectations of further tightening, perhaps also opening the door to a shorter period for restrictive rates. This in turn might cool demand for the New Zealand Dollar, hence NZD/USD’s drop after the CPI report. With that in mind, the Kiwi Dollar might be left vulnerable in the near term, let us look at how price action is shaping up.
| Change in | Longs | Shorts | OI |
| Daily | 3% | 20% | 7% |
| Weekly | 31% | -6% | 18% |
New Zealand Dollar Technical Analysis
On the daily chart below, NZD/USD can be seen idling just above the 0.5859 – 0.5886 support zone. This range has been holding up since August, resulting in indecisive price action. Meanwhile, resistance is a combination of 0.6055 and the 100-day moving average. Until prices break above/below these highlights, the technical outlook seems to favor neutral.
Breaking lower exposes the 78.6% Fibonacci retracement level of 0.5732. Otherwise, turning higher and clearing resistance exposes the 38.2% level of 0.6146.
Recommended by Daniel Dubrovsky
The Fundamentals of Breakout Trading
NZD/USD Daily Chart
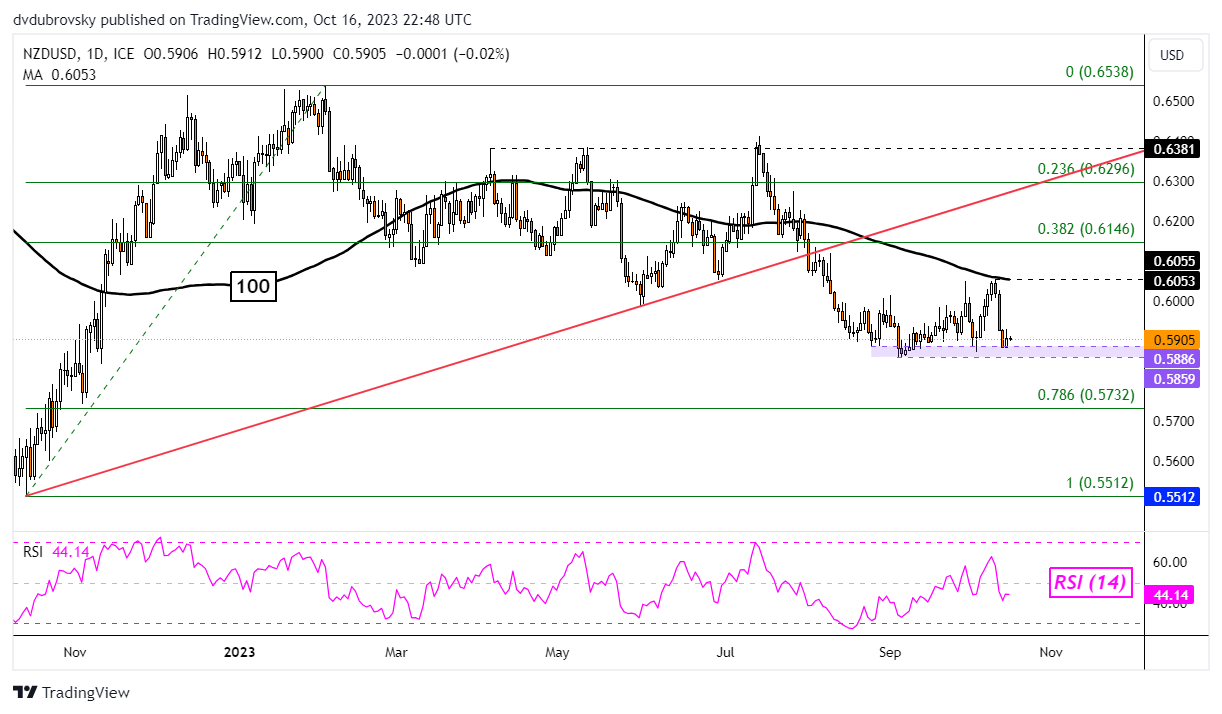
Chart Created in TradingView
— Written by Daniel Dubrovsky, Contributing Senior Strategist for DailyFX.com

 آموزش مجازی مدیریت عالی و حرفه ای کسب و کار DBA


ارسال نظر شما
مجموع نظرات : 0 در انتظار بررسی : 0 انتشار یافته : 0