

Crude Oil, WTI, Retail Trader Positioning, Technical Analysis – IGCS Commodities Update
- Crude oil prices paused rallying last week
- Retail traders slightly increased upside bets
- What is the short-term WTI outlook?
Recommended by Daniel Dubrovsky
How to Trade Oil
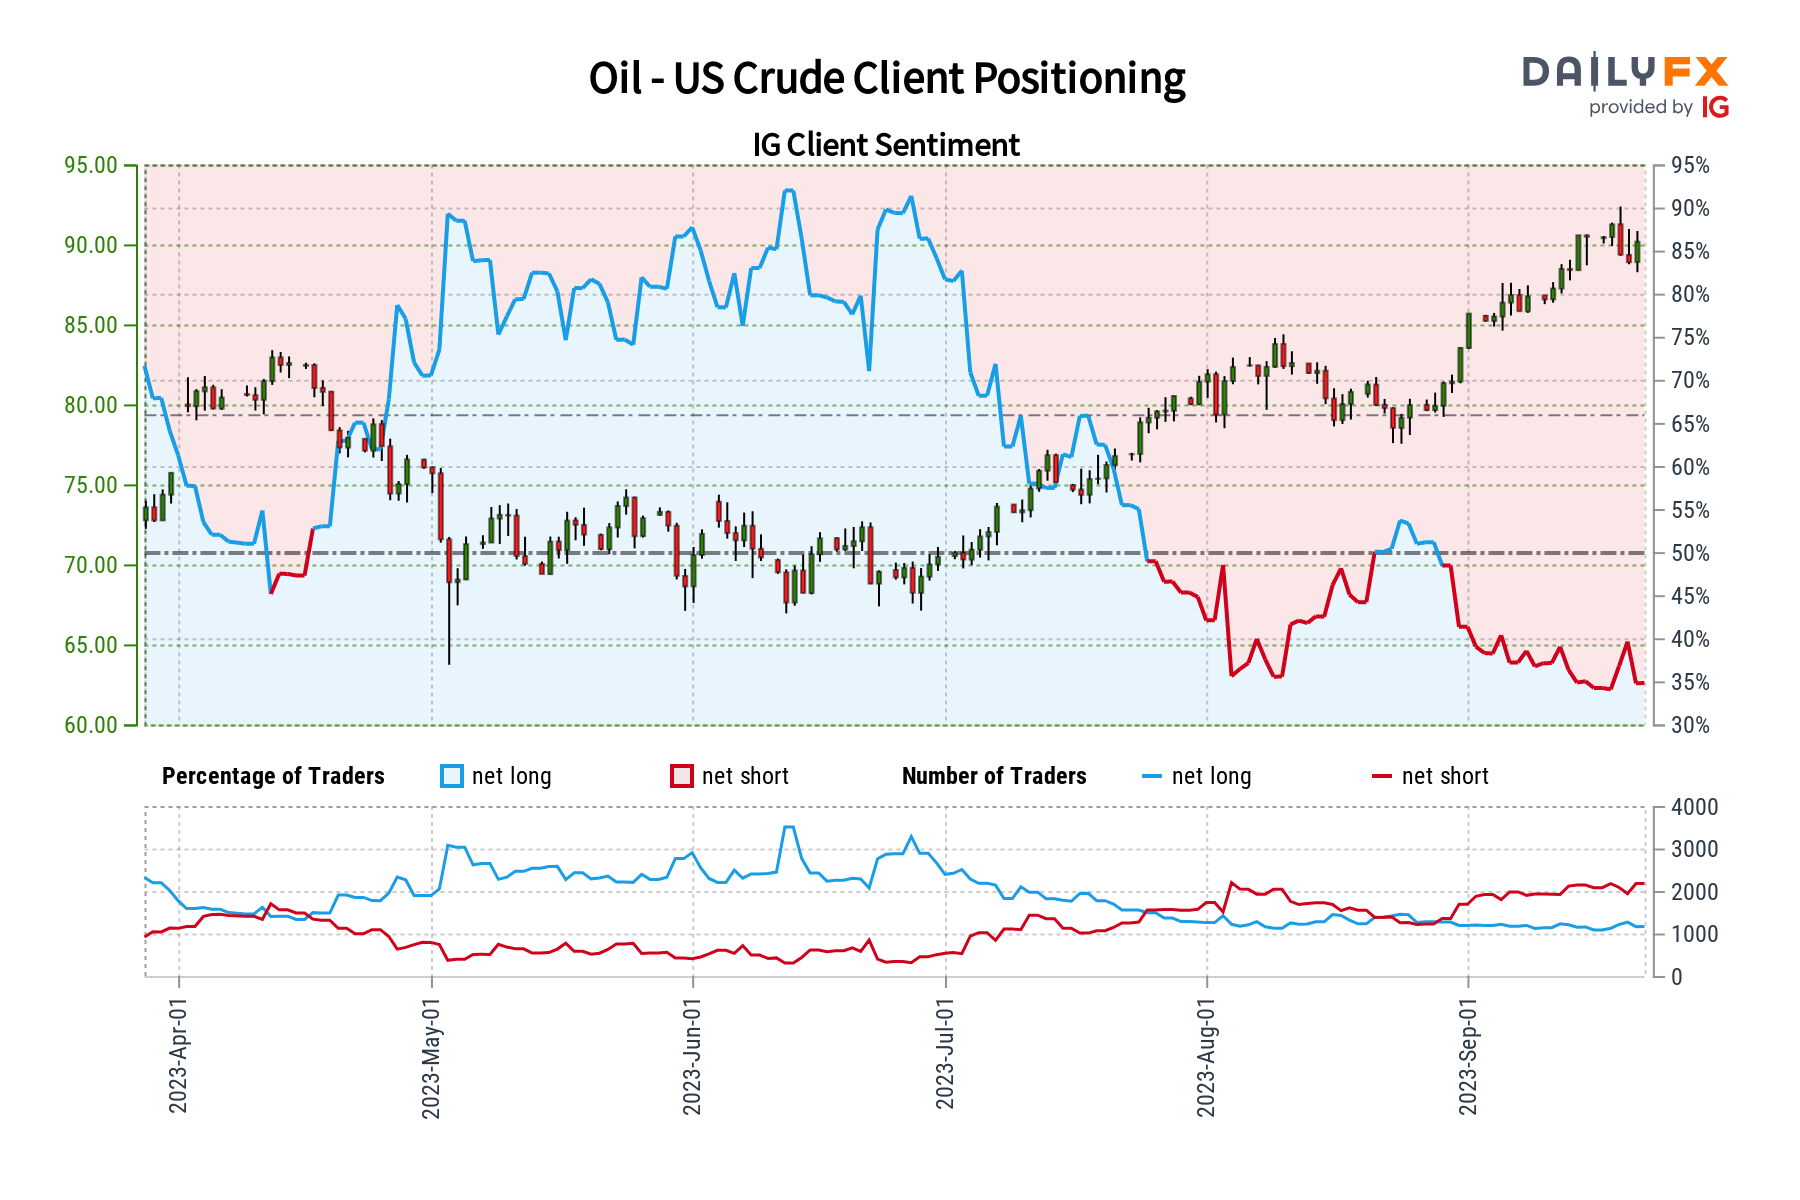
Crude oil prices took a breather last week, leaving WTI little changed by Friday. This meant a pause after weeks of consistent gains. Recent data from IG Client Sentiment (IGCS) shows that there has been a cautious increase in upside exposure in crude oil. IGCS tends to function as a contrarian indicator, with that in mind, could oil aim lower in the near term?
Crude Oil Sentiment Outlook – Bearish
According to IGCS, only 36% of retail traders are net-long crude oil. Since most of them are biased to the downside, this continues to suggest that prices may rally down the road. That said, upside exposure has increased by 7.73% and 1.81% from the last trading day and one week ago, respectively. With that in mind, recent changes in positioning hint that prices might soon reverse lower ahead.
| Change in | Longs | Shorts | OI |
| Daily | 8% | -7% | -2% |
| Weekly | 2% | 1% | 1% |
On the daily chart below, WTI has pushed higher over the past 48 hours (trading days). This is somewhat undermining the emergence of a Bearish Engulfing from last week. This followed a rejection of the 61.8% Fibonacci extension level of 88.75, where support was reinforced. As such, this is leaving a neutral technical setting in the very short term.
Key resistance is the 92.43 – 93.72 range, made up of highs from November. Meanwhile, the 20-day Moving Average is creeping higher. The latter may hold as support, maintaining the upside technical bias. Otherwise, a breakout below it subsequently places the focus on the 84.84 inflection zone.
Recommended by Daniel Dubrovsky
The Fundamentals of Breakout Trading
Crude Oil Daily Chart
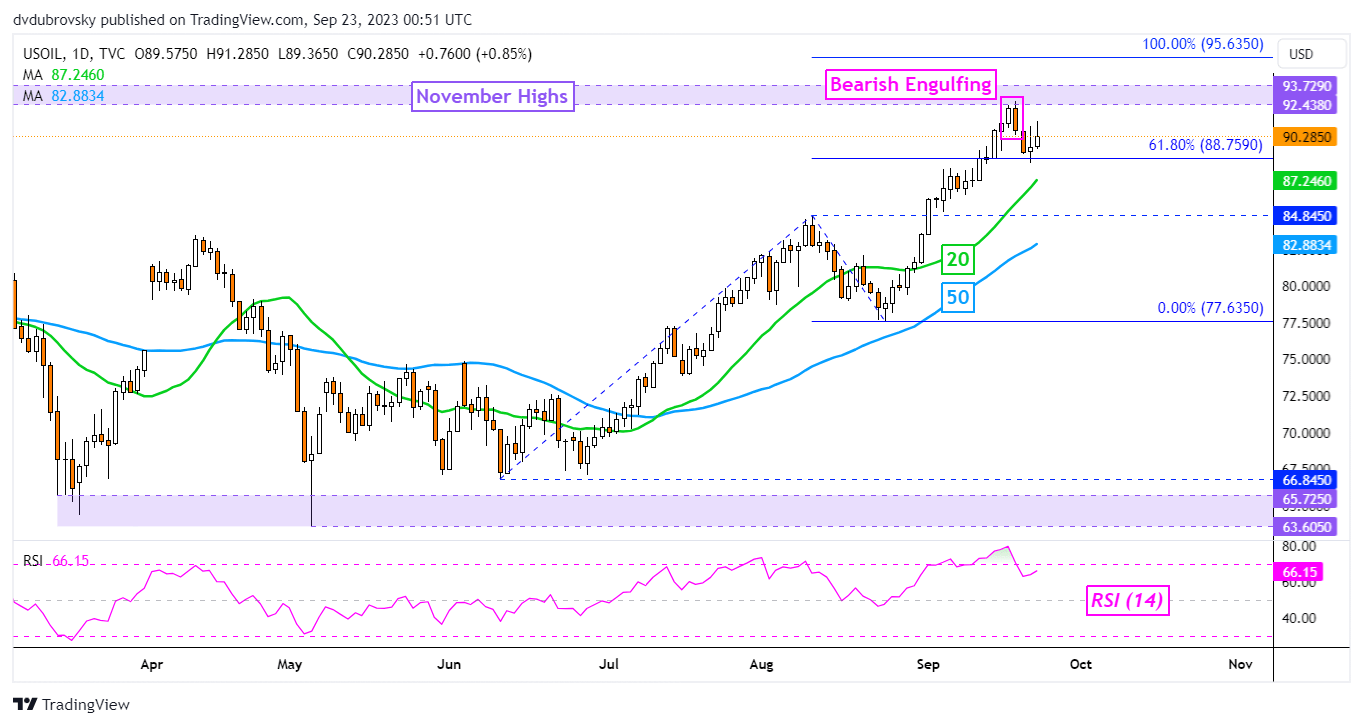
Chart Created in Trading View
— Written by Daniel Dubrovsky, Senior Strategist for DailyFX.com

 آموزش مجازی مدیریت عالی و حرفه ای کسب و کار DBA


ارسال نظر شما
مجموع نظرات : 0 در انتظار بررسی : 0 انتشار یافته : 0