

Japanese Yen, USD/JPY, RSI Divergence, Rising Support – Technical Update:
- Japanese Yen under pressure by US Dollar again after BoJ
- Watch for key upside breakout over the remaining 24 hours
- RSI divergence shows fading upside momentum on 4-hour
Recommended by Daniel Dubrovsky
Get Your Free JPY Forecast
The US Dollar is back on the offensive against the Japanese Yen. From a fundamental perspective, this follows the aftermath of what was a dovish Bank of Japan monetary policy announcement last week. Meanwhile, over the past 24 hours, the central bank announced an unscheduled debt-buying operation to help contain rising local government bond yields.
In all, JPY has weakened over 2 percent since the BoJ rate decision last week. Is USD/JPY preparing to resume the broader uptrend? Looking at the daily chart below, the currency pair is attempting to confirm a breakout above the July 21st high of 141.95. If this is achieved over the remaining 24 hours, that would place the focus on the June peak at 145.07.
Moreover, the rising trendline from March has been reinforced, maintaining the upside technical bias since the beginning of this year. Extending upward exposes the 61.8% Fibonacci extension level at 148.27. Before long the October high of 151.94 may come into focus.
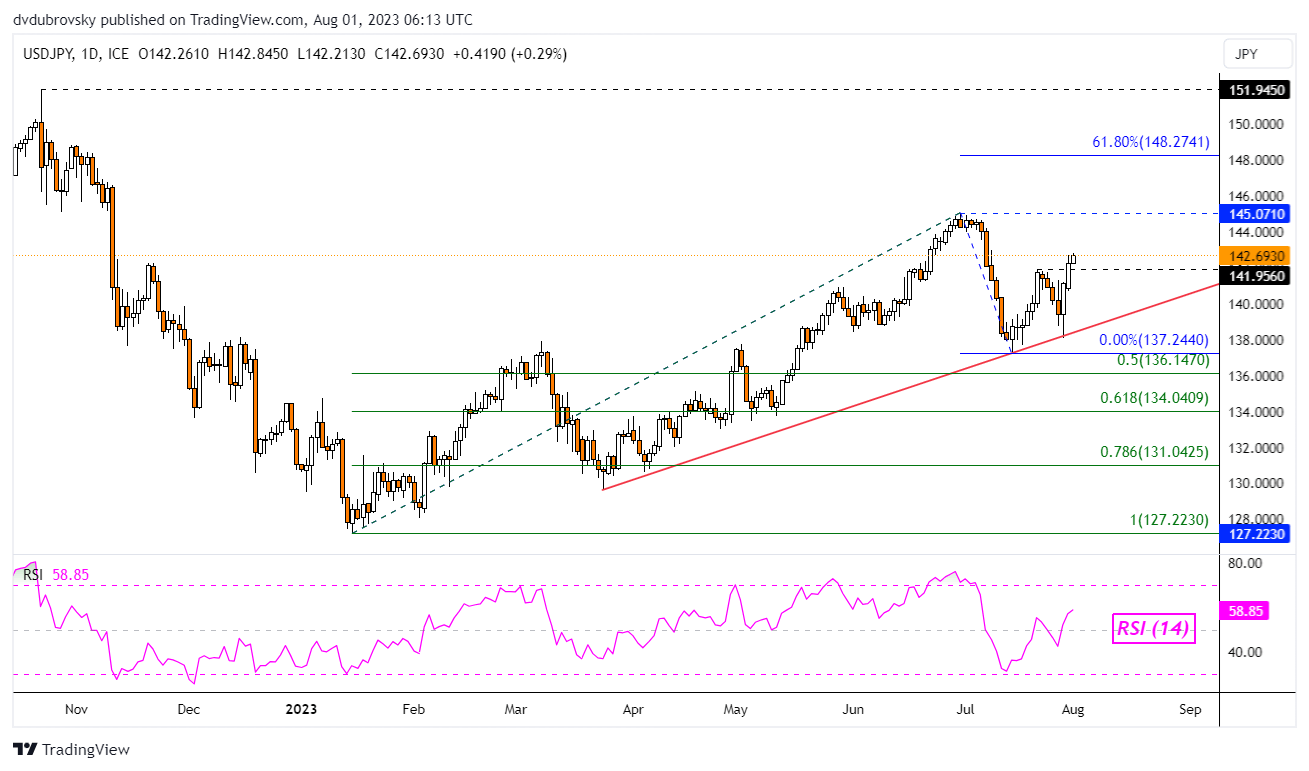
Chart Created in TradingView
Let us zoom in on the 4-hour chart to get a better picture of what the near-term trend is shaping up to be. For starters, there has been a confirmatory bullish Golden Cross between the 50- and 100-period Moving Averages (MA). That is adding fuel to the upside technical bias.
However, be mindful that in this timeframe, we do have the presence of negative RSI divergence. This is a sign of fading upside momentum, which can at times precede a turn lower. In such a case, immediate support seems to be the 61.8% Fibonacci retracement level at 142.07. Below that, the 50-period line may come into focus and hold as support, maintaining the near-term upside bias. Otherwise, key resistance above on this timeframe seems to be the 78.6% level at 143.39.
Recommended by Daniel Dubrovsky
How to Trade USD/JPY
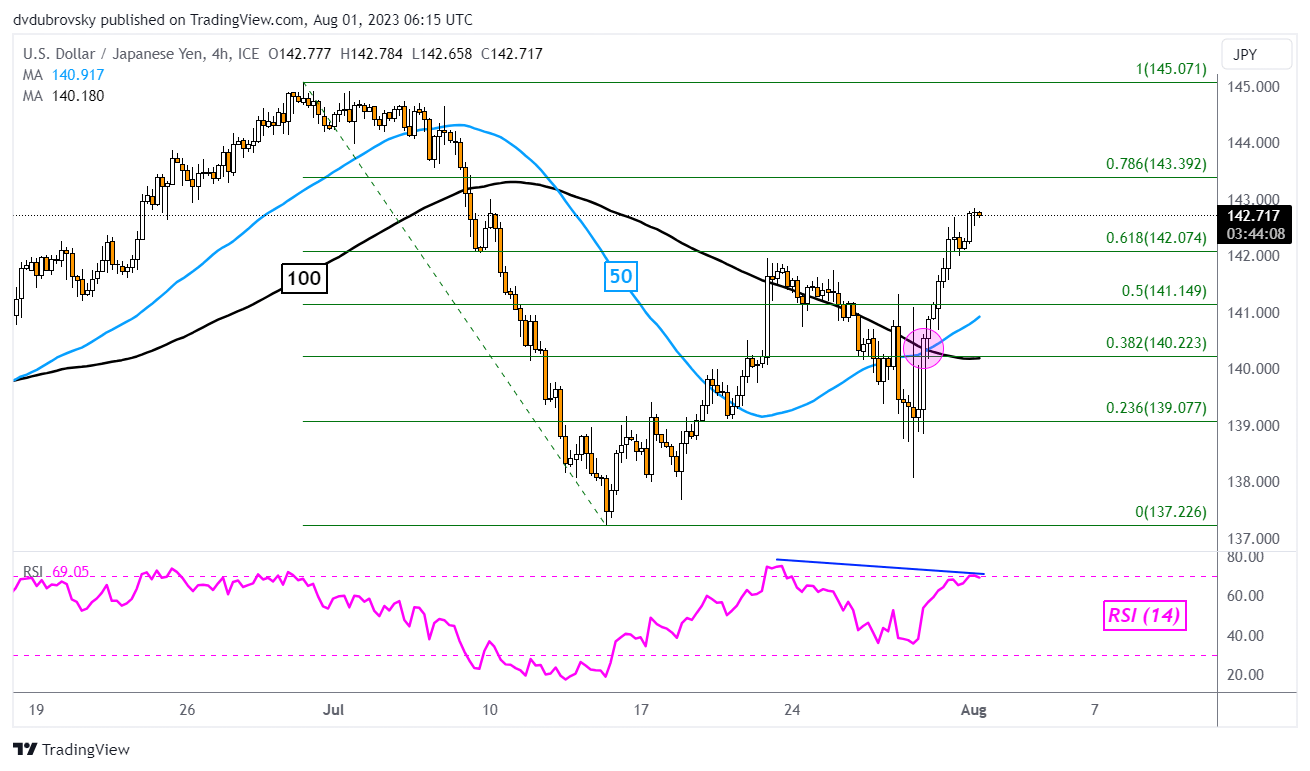
Chart Created in TradingView
— Written by Daniel Dubrovsky, Senior Strategist for DailyFX.com

 آموزش مجازی مدیریت عالی و حرفه ای کسب و کار DBA


ارسال نظر شما
مجموع نظرات : 0 در انتظار بررسی : 0 انتشار یافته : 0