
 and Silver (XAG/USD) Continue to Rally as Buyers Take Charge")
Gold (XAU/USD) and Silver (XAG/USD) Analysis and Charts
- Gold breaks higher, resistance yields.
- Silver rallies by 2% and outperforms gold.
DailyFX Economic Calendar
Most Read: Gold (XAU/USD) Price Setting Up for a Re-Test of Multi-Month Highs
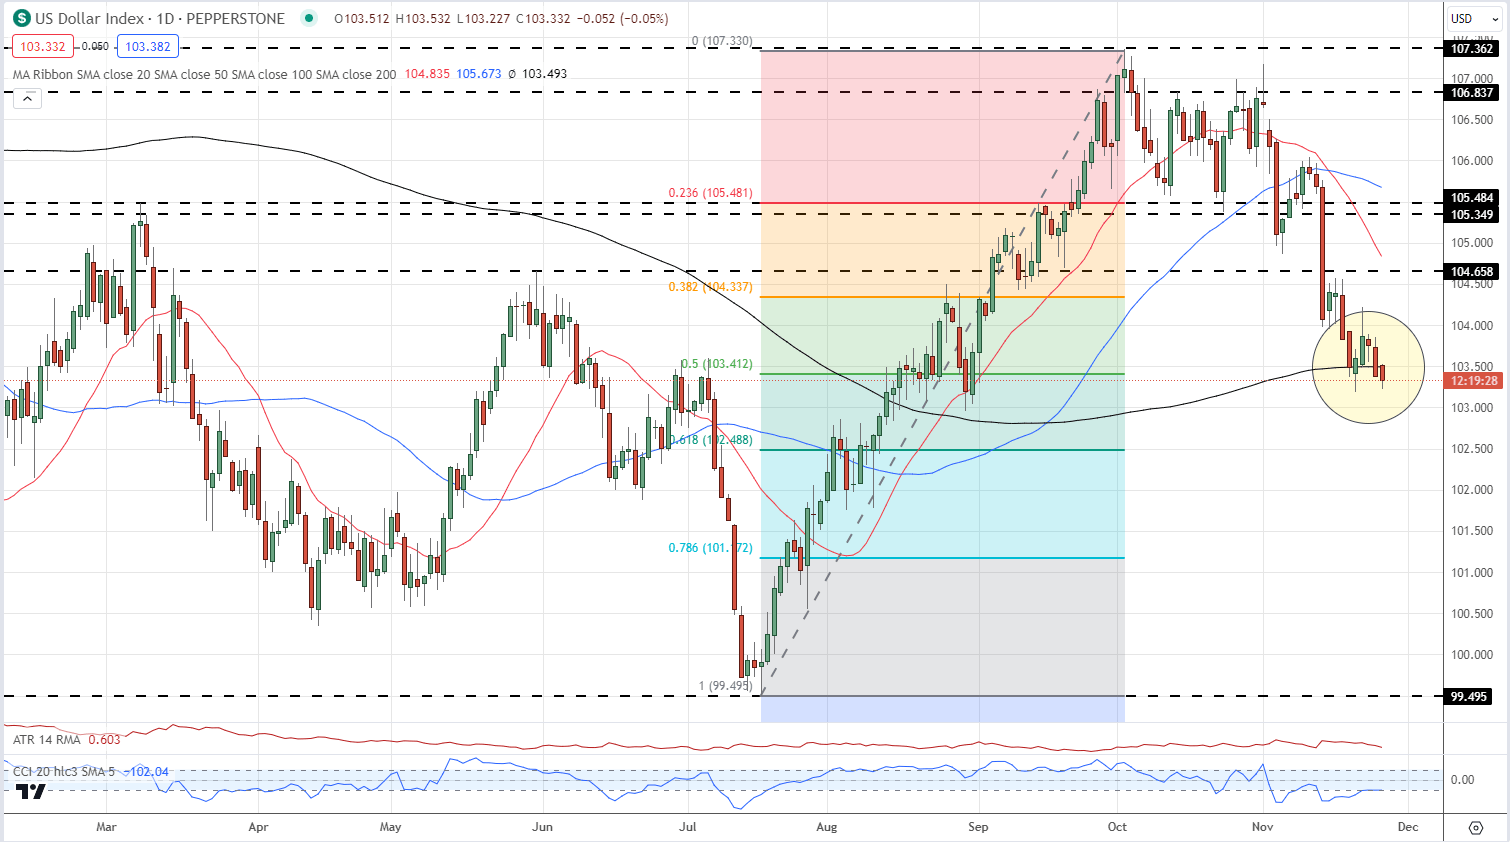
The US dollar is moving back to lows last seen in late August and this is giving the precious metal sector another boost higher. A weaker dollar is seen as a positive for both gold and silver, with demand for the precious metals increasing as gold becomes cheaper in dollar-denominated terms. The US dollar is testing support off its longer-dated simple moving average ( black line) and if this breaks, further losses look likely.
US Dollar Index Daily Chart
Retail trader data shows 57.43% of traders are net-long Gold with the ratio of traders long to short at 1.35 to 1.The number of traders net-long is 3.18% higher than yesterday and 1.18% lower than last week, while the number of traders net-short is 5.00% lower than yesterday and 18.10% higher from last week.
Download the Full Report Below
| Change in | Longs | Shorts | OI |
| Daily | 8% | 2% | 6% |
| Weekly | 2% | 23% | 11% |
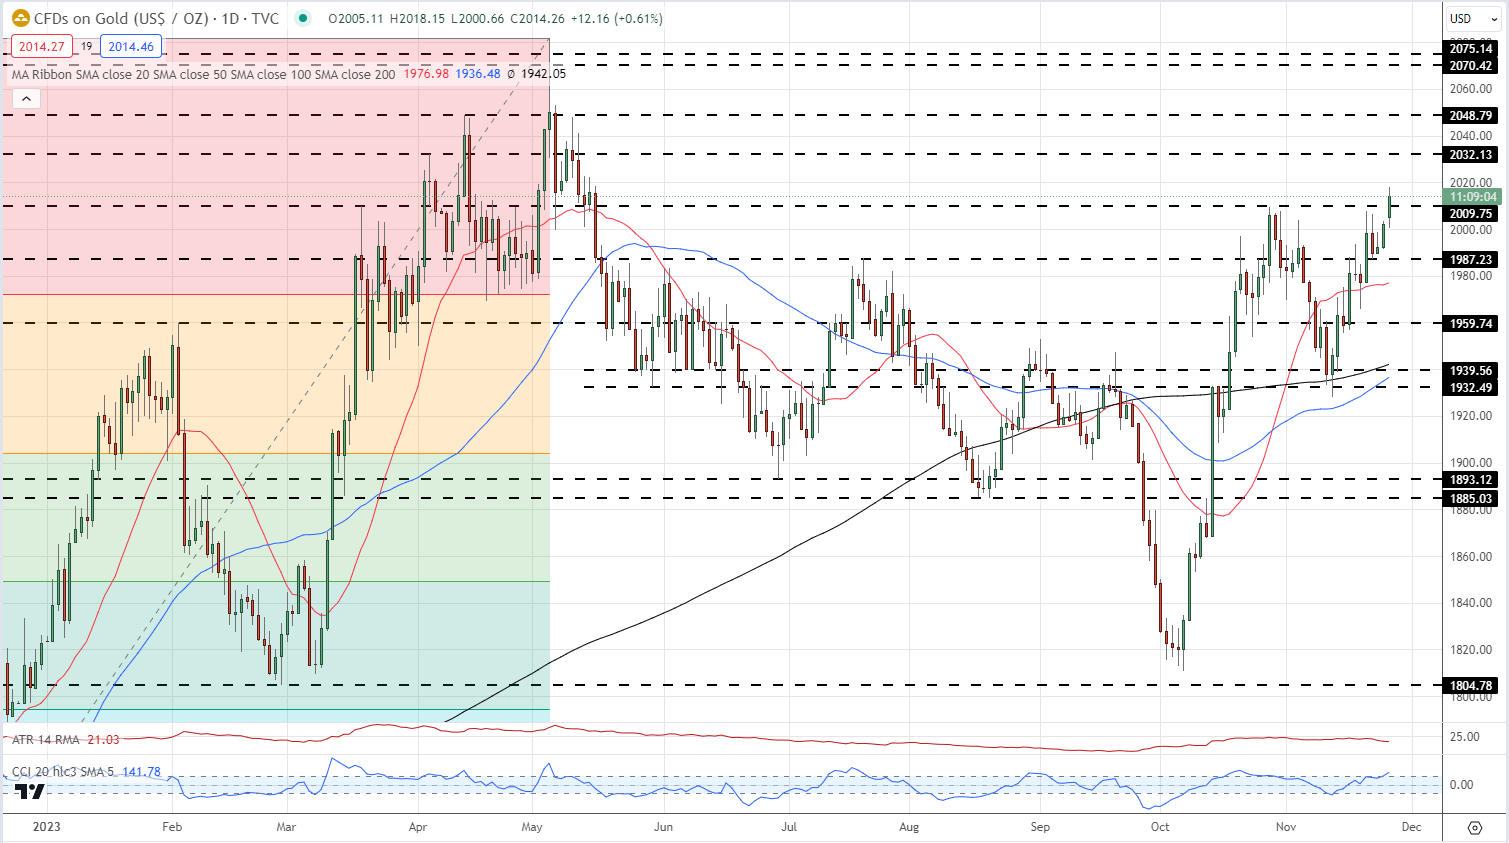
Gold is testing a prior level of resistance at $2,009/oz. and looks set to push higher. A prior level of note at $1,987/oz. is acting as first-line support, with the 20-day simple moving average, currently at $1,976/oz. the next level of interest. A close and open above $2,009/oz. should open the way to $2,032/oz. and $2,049/oz.
Gold Daily Price Chart – November 27, 2023
Learn How to Trade Gold with our Complimentary Guide
Recommended by Nick Cawley
How to Trade Gold
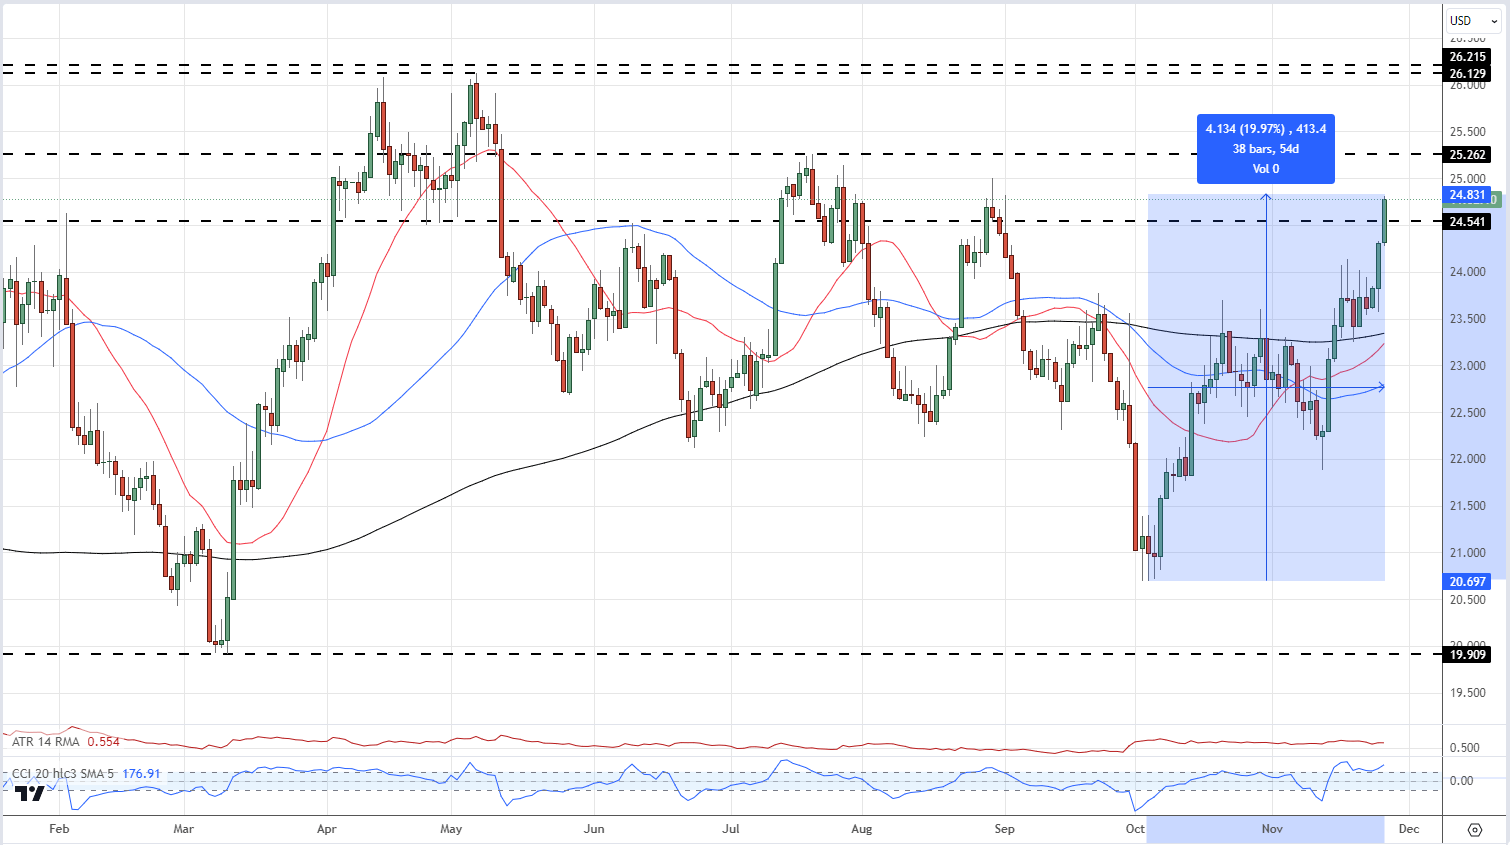
Silver is also moving higher again and is outperforming gold over the last two weeks. Silver has rallied nearly 20% over the last two months and is currently trading at its highest level since late August. The technical setup remains positive and a break above $25.26 will bring $26.13 and $26.21 into play.
Silver Daily Price Chart – November 27, 2023
Charts via TradingView
What is your view on Gold – bullish or bearish?? You can let us know via the form at the end of this piece or you can contact the author via Twitter @nickcawley1.

 آموزش مجازی مدیریت عالی و حرفه ای کسب و کار DBA


ارسال نظر شما
مجموع نظرات : 0 در انتظار بررسی : 0 انتشار یافته : 0