

Article by IG Chief Market Analyst Chris Beauchamp
Dow Jones, Nikkei 225, CAC 40 – Analysis and Charts
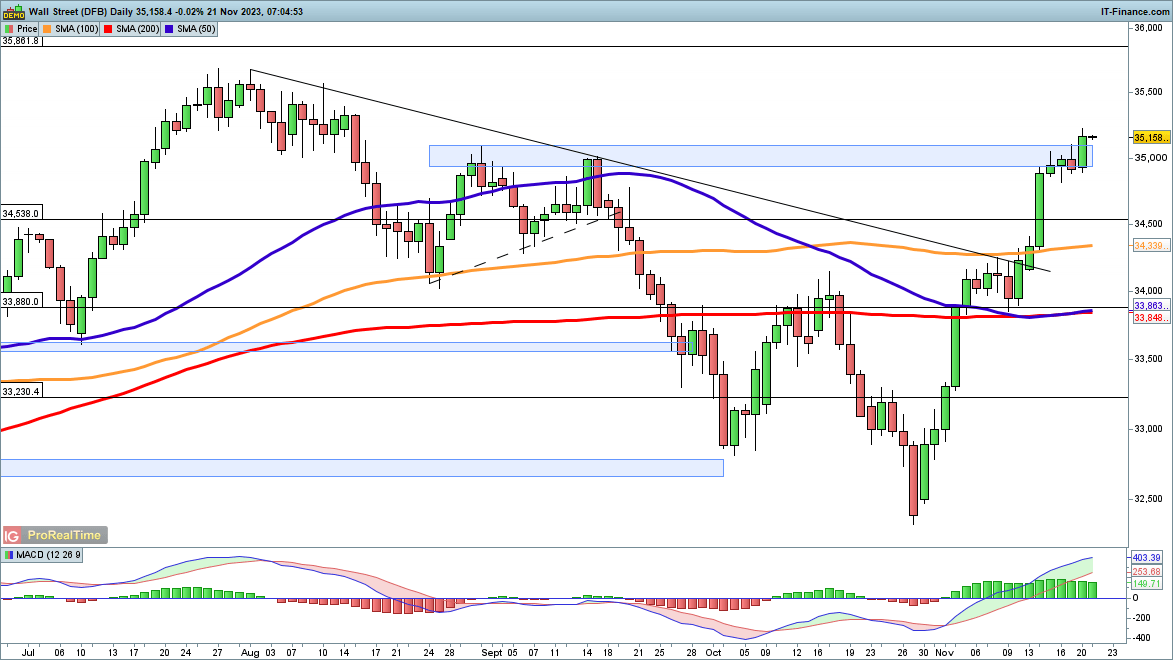
Dow above August and September highs
The index has surged through the 35,000 level, reaching its highest level since the end of August.The next target is the high from July around 35,680, and would mark the complete recovery of the losses sustained since the end of July. From here the February 2022 high at 35,860 is the next level to watch, and then beyond that comes 36,465, and then the 2022 high at 36,954.
It would need a move back below the 100-day SMA to put a more substantial dent in the overall bullish view.
Dow Jones Daily Chart
See How Daily and Weekly Changes Can Affect IG Retail Sentiment
| Change in | Longs | Shorts | OI |
| Daily | -12% | 8% | 1% |
| Weekly | -13% | 11% | 3% |
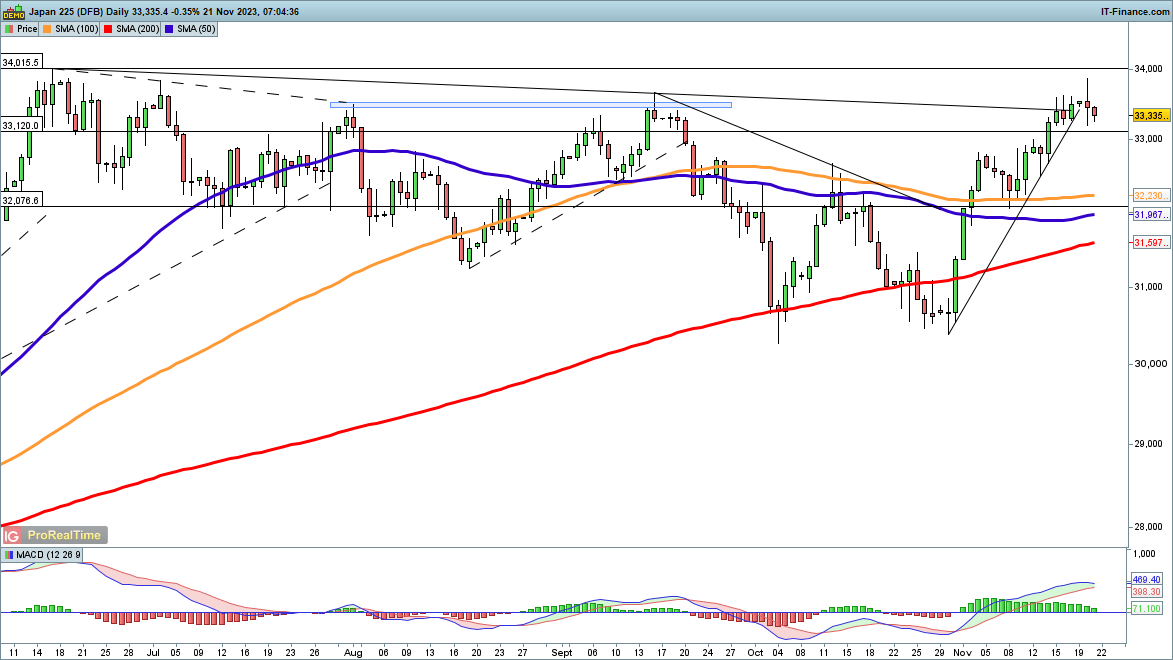
Nikkei 225 knocks on the door of June highs
Monday witnessed the index move to its highest level since the beginning of June.This puts the price above trendline resistance from the June highs and marks a step-change after the failure to break higher seen in September. Resistance may now become support, and the 34,000 level beckons.
Such impressive gains in the short term may put some pressure on the index, but as with the Dow, a reversal below the 100-day SMA would be a necessary first step to dispelling the bullish view.
Nikkei 225 Daily Chart
Recommended by IG
Get Your Free Top Trading Opportunities Forecast
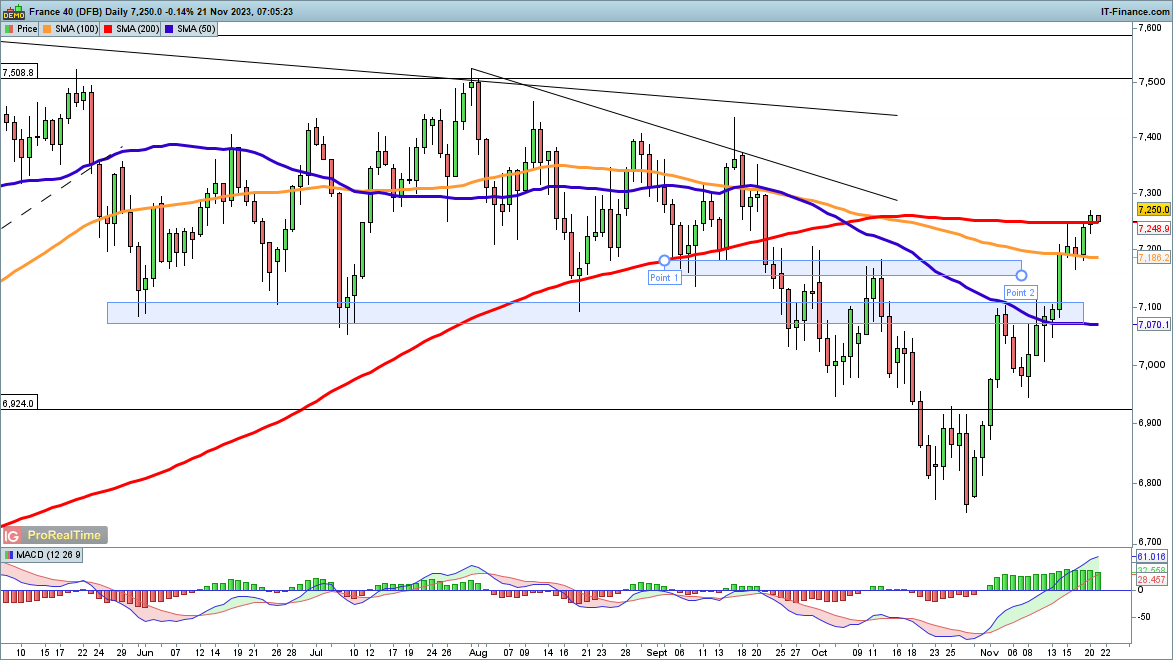
CAC40 back at 200-day MA
The index has returned to the 200-day SMA for the first time since mid-September. It has been able to move and hold above the 100-day SMA, and more importantly, has moved back above the 7170 area that marked resistance in September and October. This clears the way for a move towards 7400, where rallies in August and September were stalled.
Some consolidation back down towards the 50-day SMA could be envisaged, and the index could still create a lower high, with a close below the 50-day SMA suggesting that sellers are in the process of reasserting control.
CAC 40 Daily Chart

 آموزش مجازی مدیریت عالی و حرفه ای کسب و کار DBA


ارسال نظر شما
مجموع نظرات : 0 در انتظار بررسی : 0 انتشار یافته : 0