

Crude Oil, WTI, Bearish Engulfing – Technical Update:
- Crude oil prices turned lower over the past 24 hours
- Bearish Engulfing candlestick pattern now in focus
- Watch rising trendline, RSI divergence on 4-hour
Recommended by Daniel Dubrovsky
Get Your Free Oil Forecast
Daily Chart
WTI crude oil prices might be showing early signs of topping that might be worth paying attention to from a technical standpoint. On the daily chart below, a Bearish Engulfing has emerged. Downside confirmation is lacking at this stage, however. Further downside from here could underscore the candlestick pattern.
This is as prices trade just beneath the 92.43 – 93.72 resistance zone, which is made up of highs from November. In the event of a turn lower, keep a close eye on the 61.8% Fibonacci extension level at 88.75 before the 20-day Moving Average kicks in. Otherwise, clearing resistance exposes the 100% level at 95.63.
| Change in | Longs | Shorts | OI |
| Daily | 7% | -5% | -1% |
| Weekly | -2% | 0% | -1% |
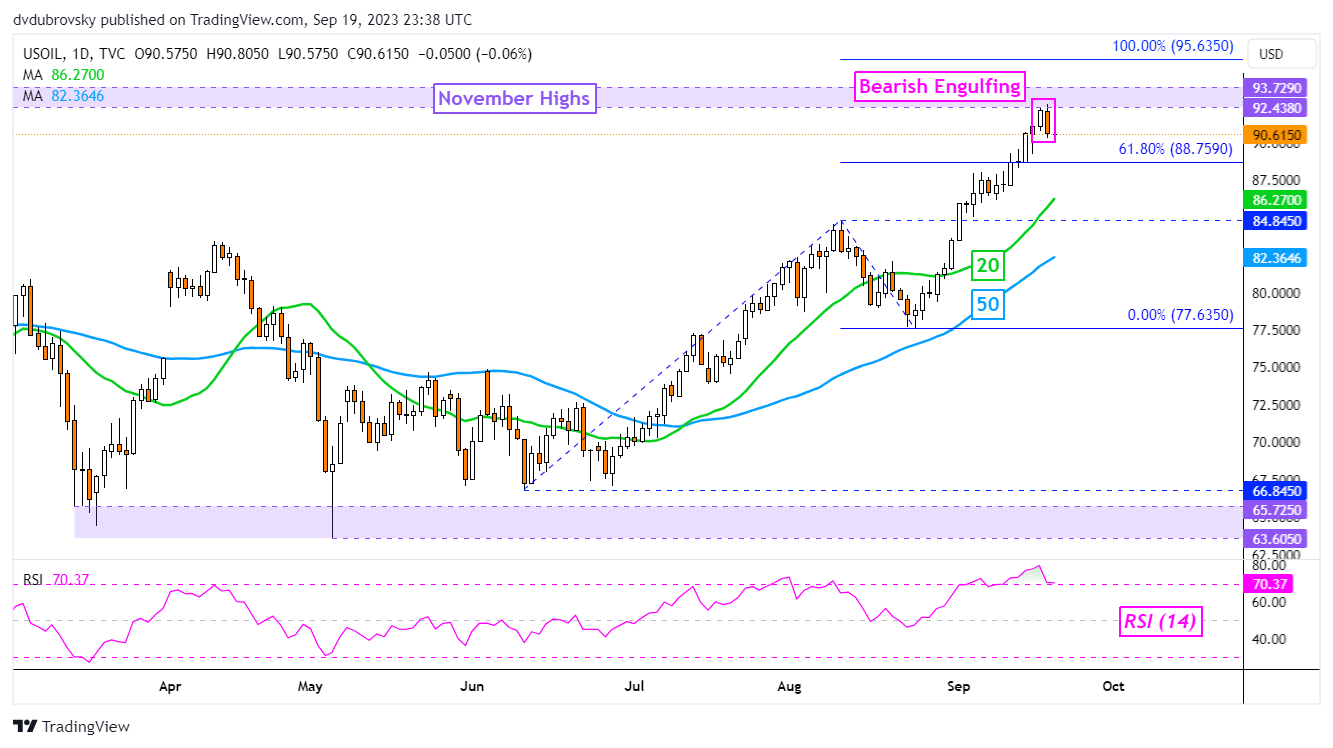
Chart Created in TradingView
4-Hour Chart
Zooming in on the 4-hour setting may offer better insight into what key levels to watch in the event of extended losses. For starters, on this timeframe, WTI is sitting around the near-term rising trendline from the end of August. A confirmatory downside breakout would underscore an increasingly near-term bearish technical bias.
Meanwhile, negative RSI divergence shows that upside momentum is fading. That can at times precede a turn lower. Such a case would expose the 23.6% and 38.2% Fibonacci retracement levels at 89.07 and 86.87, respectively. The latter is also closely aligned with the 100-day Moving Average, which may reinstate the broader upside bias.
Recommended by Daniel Dubrovsky
How to Trade Oil
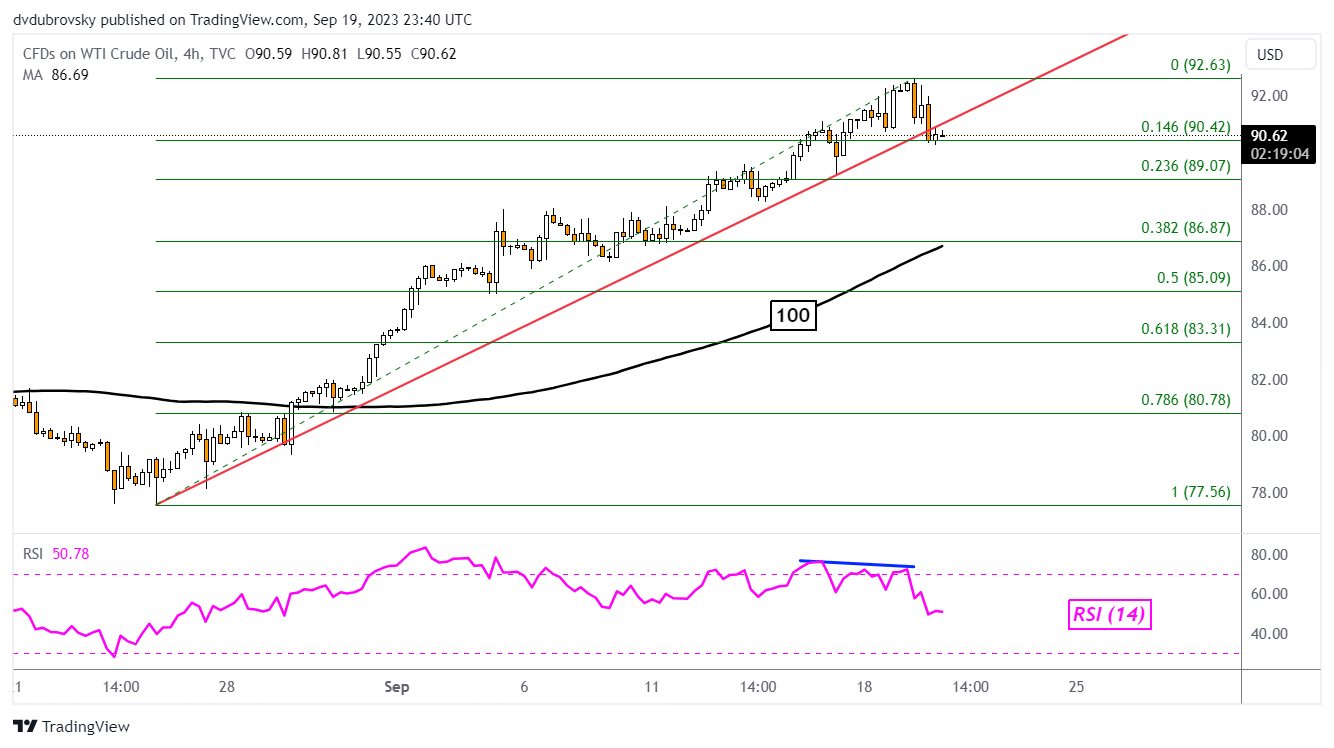
Chart Created in TradingView
— Written by Daniel Dubrovsky, Strategist for DailyFX.com

 آموزش مجازی مدیریت عالی و حرفه ای کسب و کار DBA


ارسال نظر شما
مجموع نظرات : 0 در انتظار بررسی : 0 انتشار یافته : 0