

Crude Oil, WTI, Retail Trader Positioning, Technical Analysis – IGCS Commodities Update
- Crude oil prices on course for a 7th week of gains
- Retail traders are becoming increasingly bearish
- This offers a signal that WTI may continue higher
Recommended by Daniel Dubrovsky
Get Your Free Oil Forecast
Crude oil prices have rallied nearly 24 percent since finding a bottom in June. In fact, the commodity is on course for a 7th consecutive week of gains. If confirmed, this would be the longest winning streak since January 2022.
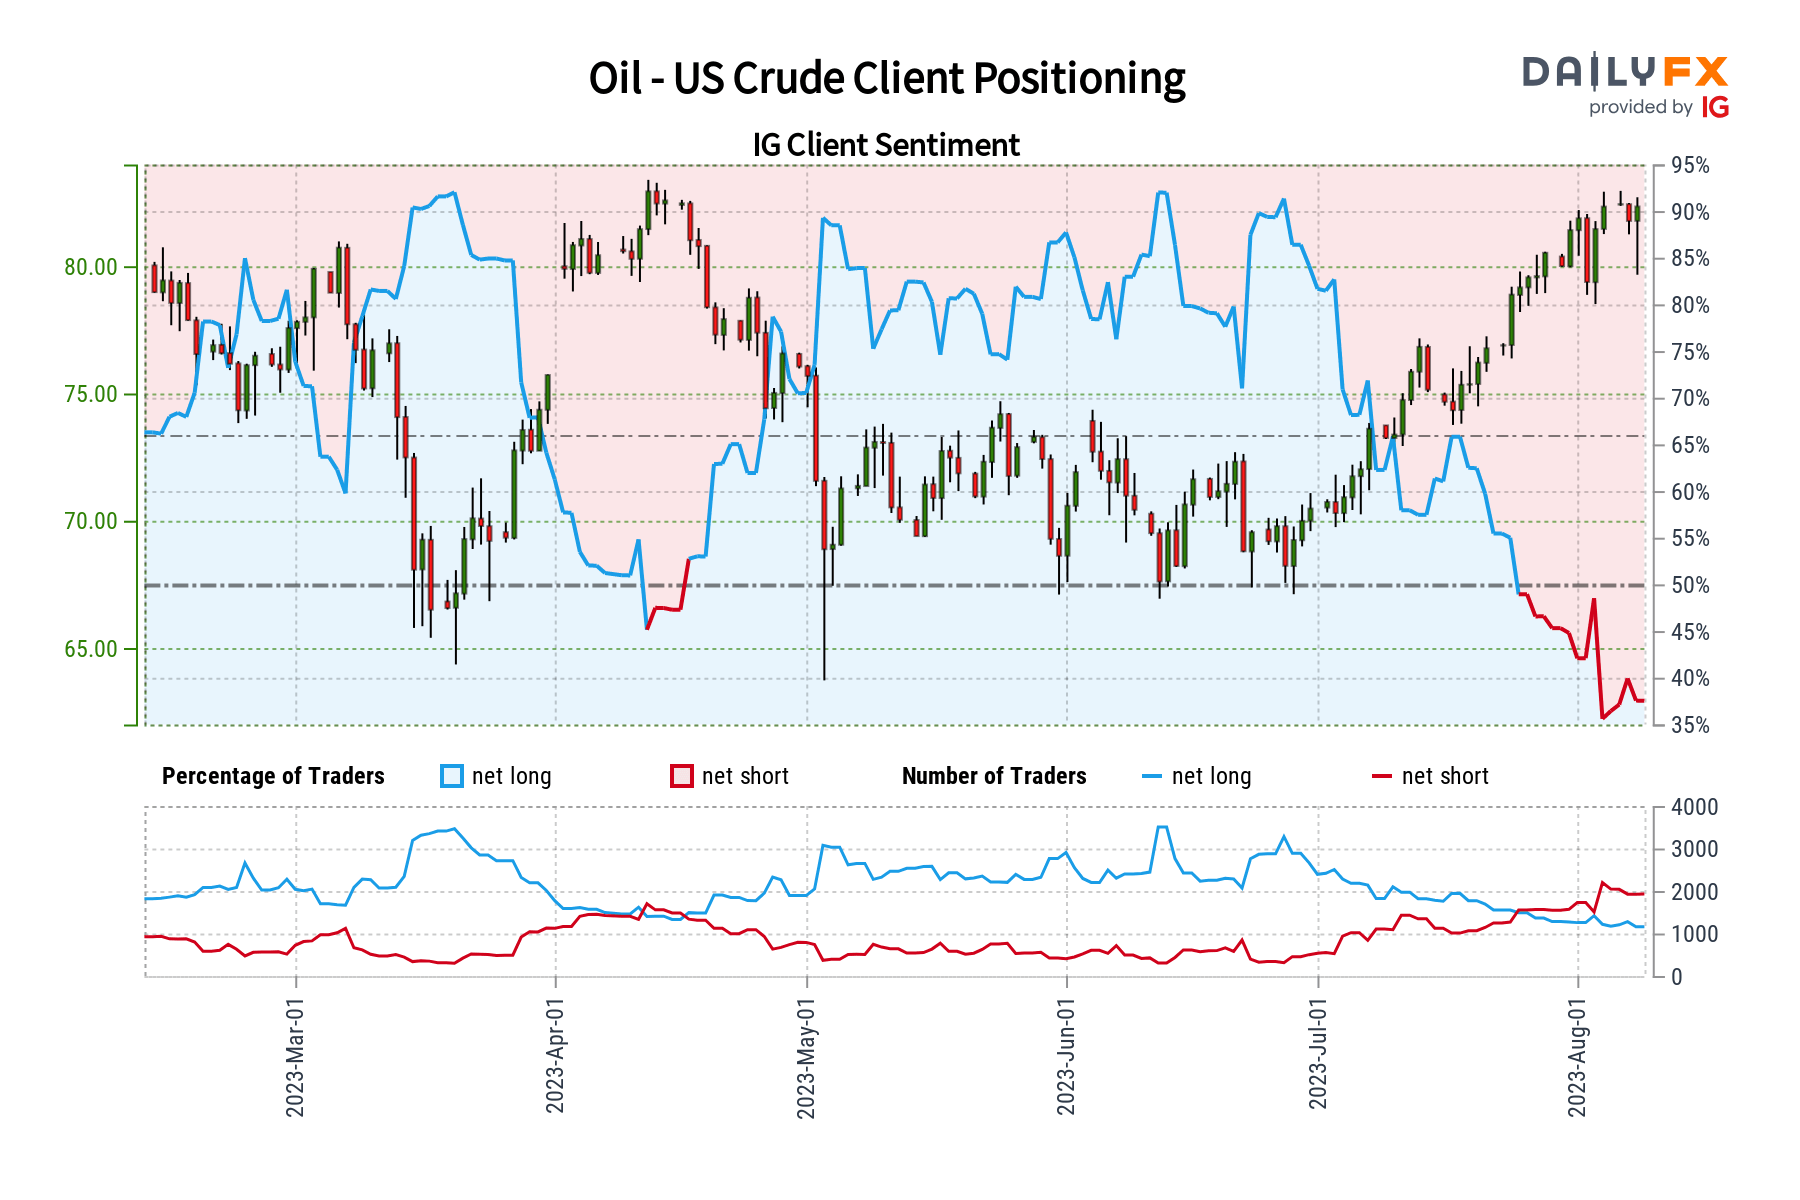
In response, retail traders have become aggressively net-short. This can be seen by taking a look at IG Client Sentiment (IGCS). IGCS tends to function as a contrarian indicator. With that in mind, might crude oil extend its winning streak?
Crude Oil Sentiment Outlook – Bullish
According to IGCS, about 38% of retail traders are net-long crude oil. Since most of them are now biased to the downside, this suggests that prices may continue higher down the road. This is as downside exposure increased by 8.13% and 11.22% compared to yesterday and last week, respectively. With that in mind, the combination of current sentiment and recent changes produces a stronger bullish contrarian trading bias.
On the daily chart below, WTI crude oil has closed above the critical 81.44 – 83.48 resistance zone. This ceiling helped maintain a neutral technical bias since the end of last year. With that in mind, Wednesday’s close marked the highest since November 2022. It also exposed the 78.6% Fibonacci retracement level at 87.28. Above that is the 92.43 – 93.72 resistance zone from the November high.
Meanwhile, a bullish Golden Cross between the 50- and 100-day Moving Averages is on the verge of forming. This continues to underscore a bullish technical bias. But, negative RSI divergence is present. This is a sign of fading upside momentum that can at times precede a turn lower. In the event of such a scenario, keep a close eye on the near-term rising trendline from June.
Recommended by Daniel Dubrovsky
How to Trade Oil
Crude Oil Daily Chart
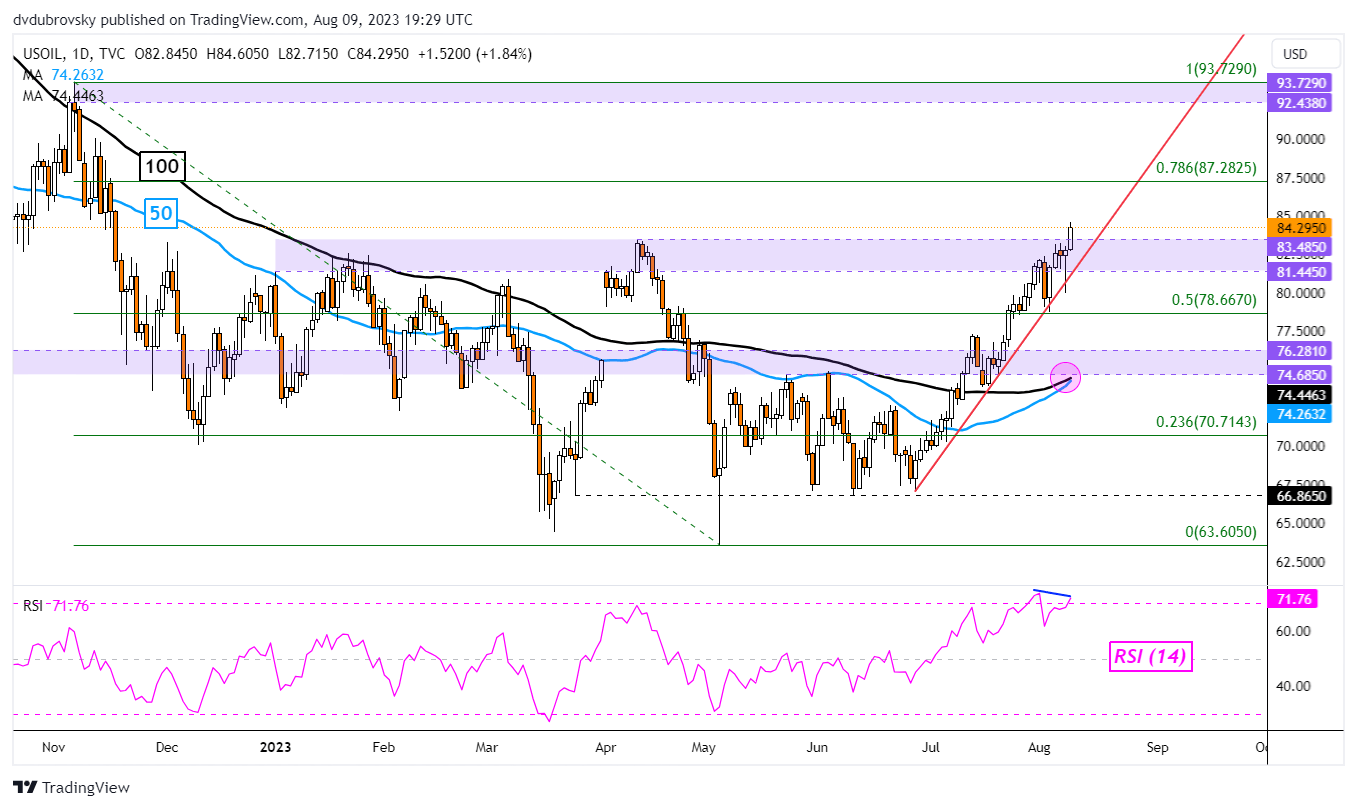
Chart Created in Trading View
— Written by Daniel Dubrovsky, Senior Strategist for DailyFX.com

 آموزش مجازی مدیریت عالی و حرفه ای کسب و کار DBA


ارسال نظر شما
مجموع نظرات : 0 در انتظار بررسی : 0 انتشار یافته : 0