

Australian Dollar, AUD/USD, Technical Analysis, Retail Trader Positioning – IGCS Update
- Australian Dollar on course for worst week since mid-June
- Retail traders continue to build increasingly bullish exposure
- AUD/USD breaks under key support, more pain to come?
Recommended by Daniel Dubrovsky
Get Your Free AUD Forecast
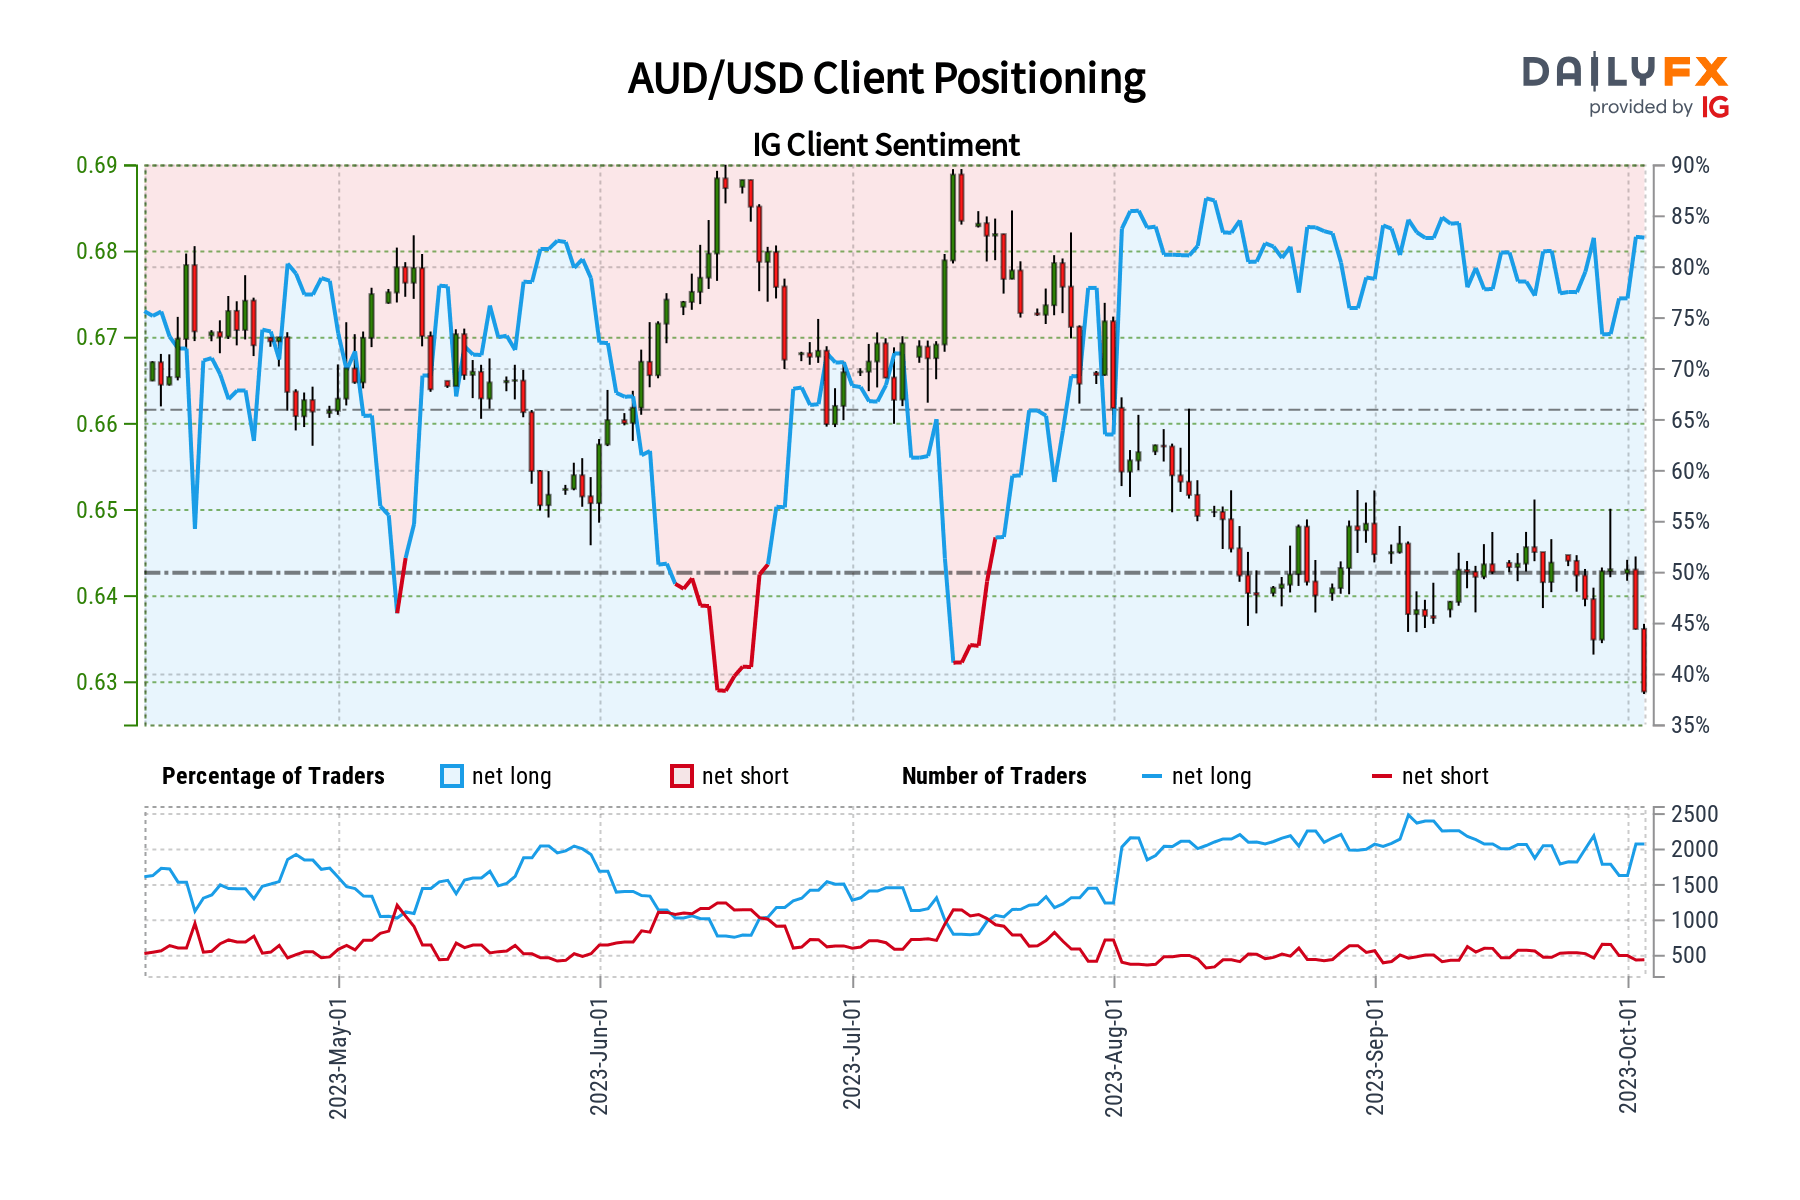
The Australian Dollar is on course to drop about -2.2% this week at this stage. If confirmed, that would be the worst 5-day drop since the middle of June. Retail traders continue to become increasingly bullish and this can be seen by looking at IG Client Sentiment (IGCS), which often functions as a contrarian indicator. With that in mind, is the Aussie on course to extend its losing streak?
AUD/USD Sentiment Outlook – Bearish
The IGCS gauge shows that about 85% of retail traders are net-long AUD/USD. Since the vast majority are biased to the upside, this continues to hint that prices may continue lower from here down the road. This is as upside bets increased by 14.21% and 5.76% compared to yesterday and last week, respectively. With that in mind, the combination of overall positioning and recent changes offers a stronger bearish contrarian trading bias.
| Change in | Longs | Shorts | OI |
| Daily | 7% | 15% | 8% |
| Weekly | 7% | -8% | 4% |
Australian Dollar Daily Chart
Focusing on the daily chart, AUD/USD has confirmed a breakout under the 78.6% Fibonacci retracement level of 0.6382. While there have been closes under this level before in recent weeks, this is the first meaningful consecutive daily drop under it. This has exposed the November 2022 low of 0.6272 as immediate support.
Positive RSI divergence is present showing that downside momentum is fading. That can at times precede a turn higher. Such an outcome would place the focus on the 20- and 50-day moving averages as immediate resistance. These may maintain the broader bearish technical perspective, placing the focus on a potential revisit of the 2022 low of 0.6170.
Recommended by Daniel Dubrovsky
How to Trade AUD/USD
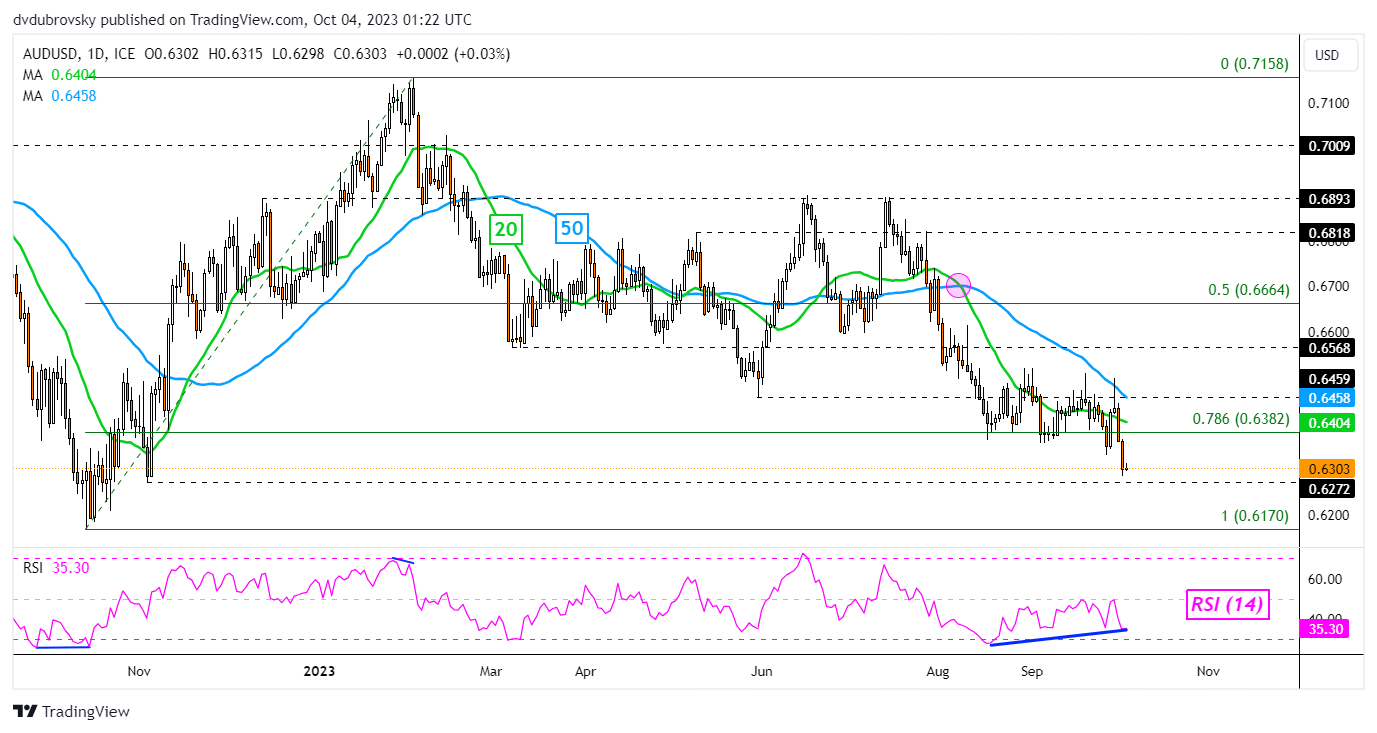
Chart Created in Trading View
— Written by Daniel Dubrovsky, Senior Strategist for DailyFX.com

 آموزش مجازی مدیریت عالی و حرفه ای کسب و کار DBA


ارسال نظر شما
مجموع نظرات : 0 در انتظار بررسی : 0 انتشار یافته : 0