
US Dollar in Freefall After US CPI, Setups on EUR/USD, GBP/USD, Nasdaq 100, Gold
[ad_1] US DOLLAR, EUR/USD, GBP/USD, NASDAQ 100, GOLD PRICE FORECAST The U.S. dollar slumps on falling yields following lower-than-expected U.S. inflation figures EUR/USD and GBP/USD break out to the topside, reaching multi-week highs Gold prices and the Nasdaq 100 also rally, flirting with key technical levels in both cases Recommended by Diego Colman Forex for

[ad_1]
US DOLLAR, EUR/USD, GBP/USD, NASDAQ 100, GOLD PRICE FORECAST
- The U.S. dollar slumps on falling yields following lower-than-expected U.S. inflation figures
- EUR/USD and GBP/USD break out to the topside, reaching multi-week highs
- Gold prices and the Nasdaq 100 also rally, flirting with key technical levels in both cases
Recommended by Diego Colman
Forex for Beginners
Most Read: US Inflation Cools to 3.2 % in October, US Dollar Sinks but Gold Gains
U.S. Treasury yields plummeted on Tuesday after weaker-than-expected U.S. consumer price index data reduced the likelihood of additional central bank tightening and weakened the case for keeping interest rates at elevated levels for an extended period.
The move in the fixed-income space sent the broader U.S. dollar reeling, with the DXY index plunging more than 1.5%, its worst daily performance since November 2022. Against this backdrop, the euro and British pound broke out to the topside, hitting multi-week highs against the greenback.
Gold prices also posted solid gains and managed to consolidate decisively above the 200-day simple moving average, a bullish technical signal. For its part, the Nasdaq 100 catapulted to its best levels in almost four months, coming within a hair’s breadth of reclaiming its 2023 peak.
With traders declaring victory in the fight against inflation and already pricing in aggressive rate cuts for 2024, recent market moves may gain traction and consolidate in the near term. This could mean more downside for yields and the U.S. dollar, along with additional gains for precious metals and stocks.
This piece scrutinizes EUR/USD, GBP/USD, the Nasdaq 100, and gold prices from a technical perspective. We delve into significant price levels that require attention following Tuesday’s noteworthy moves across key assets.
For a comprehensive assessment of the euro’s medium-term prospects, make sure to download our Q4 outlook!
Recommended by Diego Colman
Get Your Free EUR Forecast
EUR/USD TECHNICAL ANALYSIS
EUR/USD soared on Tuesday, taking out Fibonacci resistance and the 200-day simple moving average. With momentum on its side and a positive shift in sentiment, the pair may extend its upward trajectory in the days ahead, with a potential target at 1.0960, the 61.8% Fib retracement of the July/October selloff.
In the case where EUR/USD fails to hold onto gains and sellers regain dominance, the first technical support to monitor appears around the 1.0840 mark, followed by the psychological 1.0800 handle. Continued weakness increases the risk of revisiting the 1.0650 area.
EUR/USD TECHNICAL CHART
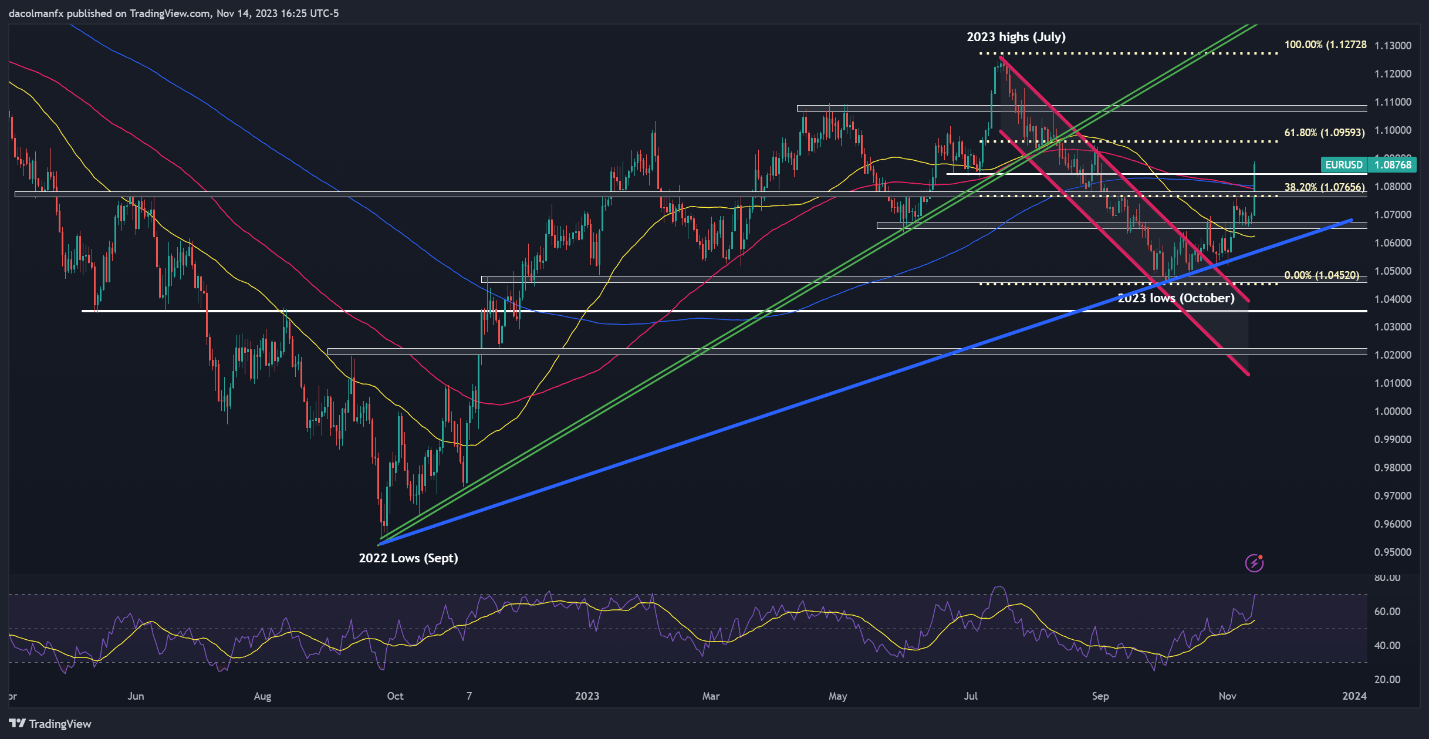
EUR/USD Chart Created Using TradingView
Interested in learning how retail positioning can shape the short-term trajectory of GBP/USD? Our sentiment guide explains the role of crowd mentality in FX markets. Request your free copy now!
| Change in | Longs | Shorts | OI |
| Daily | -29% | 48% | -5% |
| Weekly | -22% | 32% | -3% |
GBP/USD TECHNICAL ANALYSIS
GBP/USD also blasted higher on Tuesday, surging past its 200-day simple moving average and breaching the 38.2% Fib retracement of the July/October slump. If this bullish breakout is sustained in the coming trading sessions, buyers could be emboldened to launch an attack on 1.2591 (50% Fib retracement).
Conversely, if upward impetus fades and sentiment shifts in favor of sellers, initial support is identified between 1.2460 and 1.2450. Maintaining prices above this floor is necessary to instill confidence in the bullish outlook; a failure to do so might trigger a retreat towards 1.2320 and 1.2200 thereafter.
GBP/USD TECHNICAL CHART
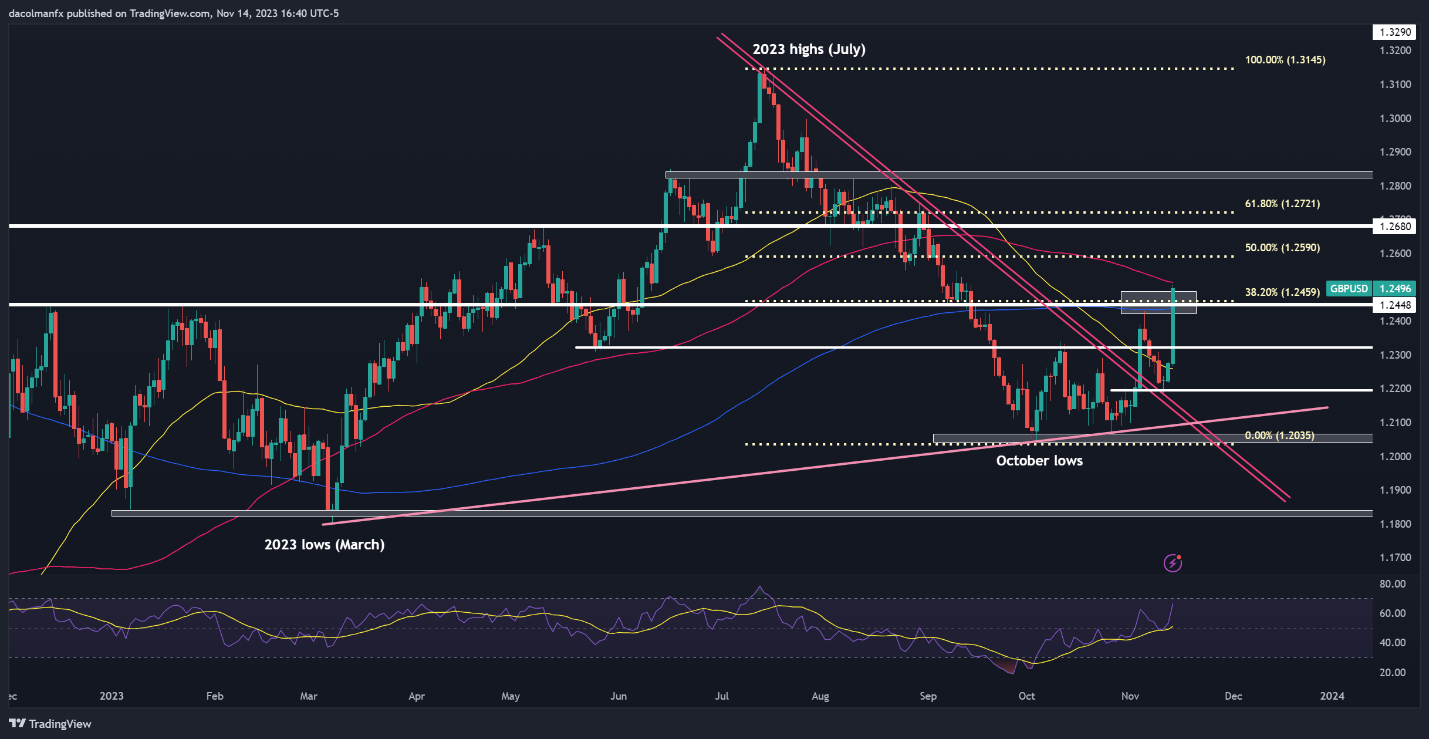
GBP/USD Chart Created Using TradingView
If you’re looking for in-depth analysis of U.S. equity indices, our Q4 stock market trading forecast is packed with great fundamental and technical insights. Get a free copy now!
Recommended by Diego Colman
Get Your Free Equities Forecast
NASDAQ 100 TECHNICAL ANALYSIS
The Nasdaq 100 rallied more than 2.2% on Tuesday on the back of falling U.S. yields following weaker-than-expected U.S. CPI numbers. With traders already discounting a dovish pivot at the Fed, sentiment could remain positive, creating the right conditions for equity market strength.
In terms of key technical thresholds, the first resistance to watch corresponds to the July highs near the 16,067 level. On further strength, the focus shifts to last year’s peak. If a bearish reversal unfolds, initial support is located at 15,720, followed by 15,500/15,400.
NASDAQ 100 TECHNICAL CHART
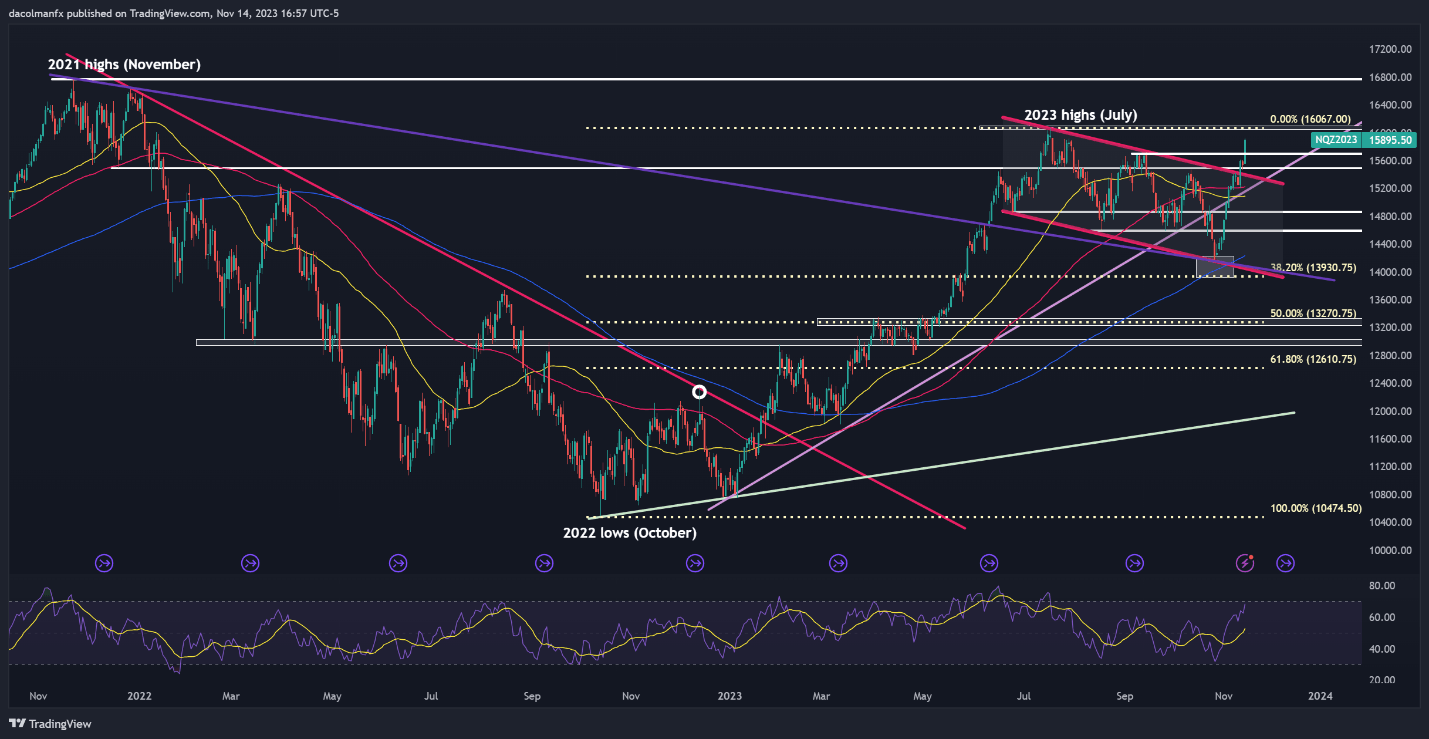
Nasdaq 100 Chart Created Using TradingView
Eager to gain insights into gold’s future trajectory and the upcoming market drivers for volatility? Discover the answers in our complimentary Q4 trading guide.
Recommended by Diego Colman
Get Your Free Gold Forecast
GOLD PRICE TECHNICAL ANALYSIS
After a few days of softness, gold executed a bullish reversal on Tuesday, bouncing off cluster support at $1,940/$$1,950. Should prices successfully build on this upward momentum, initial resistance lies at $1,975/$1,980. Upside clearance of this ceiling could open the door for a rally towards $2,010/$2,015.
Conversely, in the event of sellers regaining control of the market, primary support stretches from $1,950 to $1,940. Although gold may establish a base in this range during a retracement, a breakdown could set the stage for a drop toward $1,920, followed by $1,900.
GOLD PRICE CHART (FUTURES CONTRACTS)
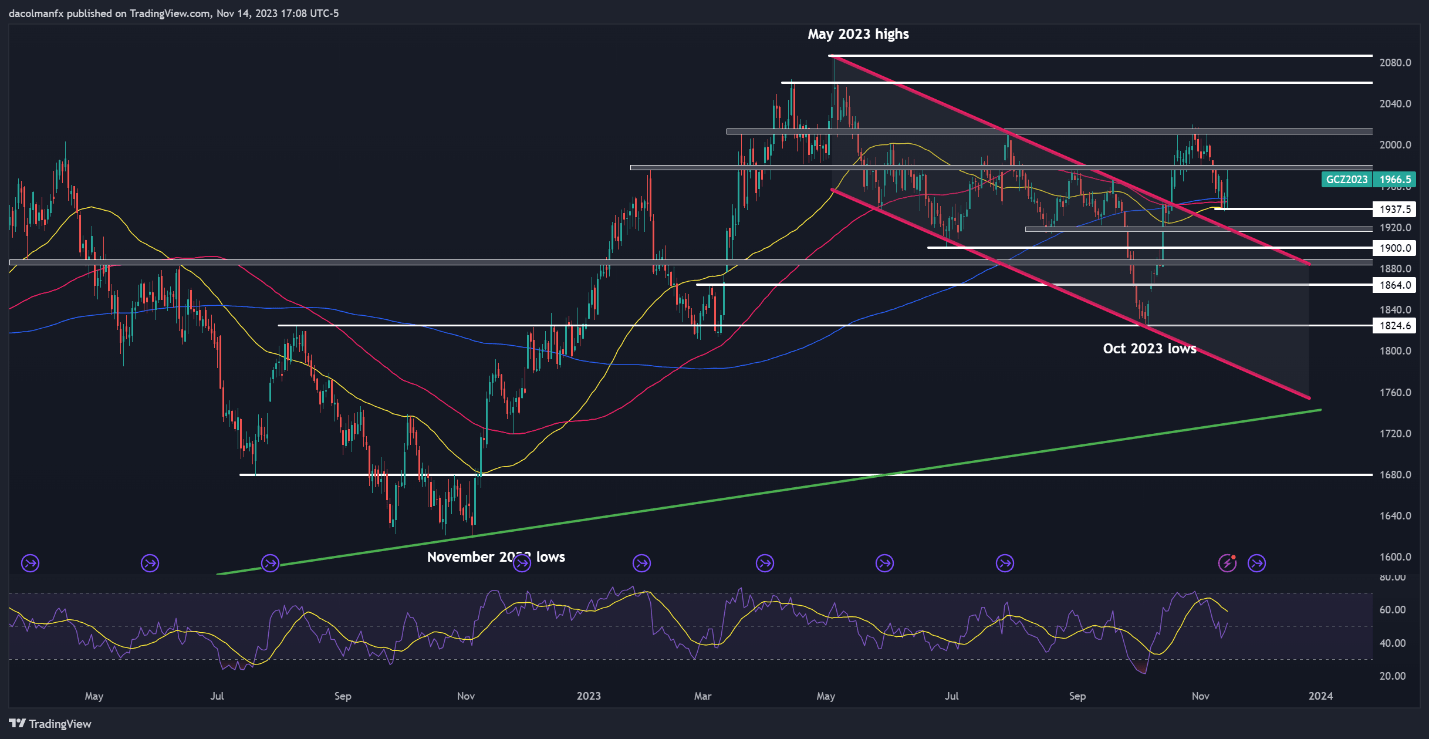
Gold Price Chart Created Using TradingView
[ad_2]
لینک منبع : هوشمند نیوز
 آموزش مجازی مدیریت عالی حرفه ای کسب و کار Post DBA آموزش مجازی مدیریت عالی حرفه ای کسب و کار Post DBA+ مدرک معتبر قابل ترجمه رسمی با مهر دادگستری و وزارت امور خارجه |  آموزش مجازی مدیریت عالی و حرفه ای کسب و کار DBA آموزش مجازی مدیریت عالی و حرفه ای کسب و کار DBA+ مدرک معتبر قابل ترجمه رسمی با مهر دادگستری و وزارت امور خارجه |  آموزش مجازی مدیریت کسب و کار MBA آموزش مجازی مدیریت کسب و کار MBA+ مدرک معتبر قابل ترجمه رسمی با مهر دادگستری و وزارت امور خارجه |
 مدیریت حرفه ای کافی شاپ |  حقوقدان خبره |  سرآشپز حرفه ای |
 آموزش مجازی تعمیرات موبایل آموزش مجازی تعمیرات موبایل |  آموزش مجازی ICDL مهارت های رایانه کار درجه یک و دو |  آموزش مجازی کارشناس معاملات املاک_ مشاور املاک آموزش مجازی کارشناس معاملات املاک_ مشاور املاک |
- نظرات ارسال شده توسط شما، پس از تایید توسط مدیران سایت منتشر خواهد شد.
- نظراتی که حاوی تهمت یا افترا باشد منتشر نخواهد شد.
- نظراتی که به غیر از زبان فارسی یا غیر مرتبط با خبر باشد منتشر نخواهد شد.


ارسال نظر شما
مجموع نظرات : 0 در انتظار بررسی : 0 انتشار یافته : 0