

Euro, EUR/USD, EUR/GBP – Technical Update:
- Euro might continue to weaken in the near term
- EUR/USD all set for the worst week since May?
- EUR/GBP ready to continue consolidation?
Recommended by Daniel Dubrovsky
Get Your Free EUR Forecast
The Euro extended its losing streak against the US Dollar on Wednesday, with EUR/USD sinking 0.6 percent. At -1.3%, the single currency is also on course for the worst weekly performance since early May. How is the near-term technical landscape shaping up?
Over the past 24 hours, prices closed under the March low of 1.0516, exposing immediate support as the 100% Fibonacci extension at 1.0436 on the daily chart below. Further losses would subsequently place the focus on the 123.6% level of 1.0315.
Meanwhile, in the event of a turn higher, keep a close eye on the falling trendline from July. This could hold as resistance, reinstating the broader downside focus. But, getting their entails also facing the 61.8% level at 1.0631.
Recommended by Daniel Dubrovsky
How to Trade EUR/USD
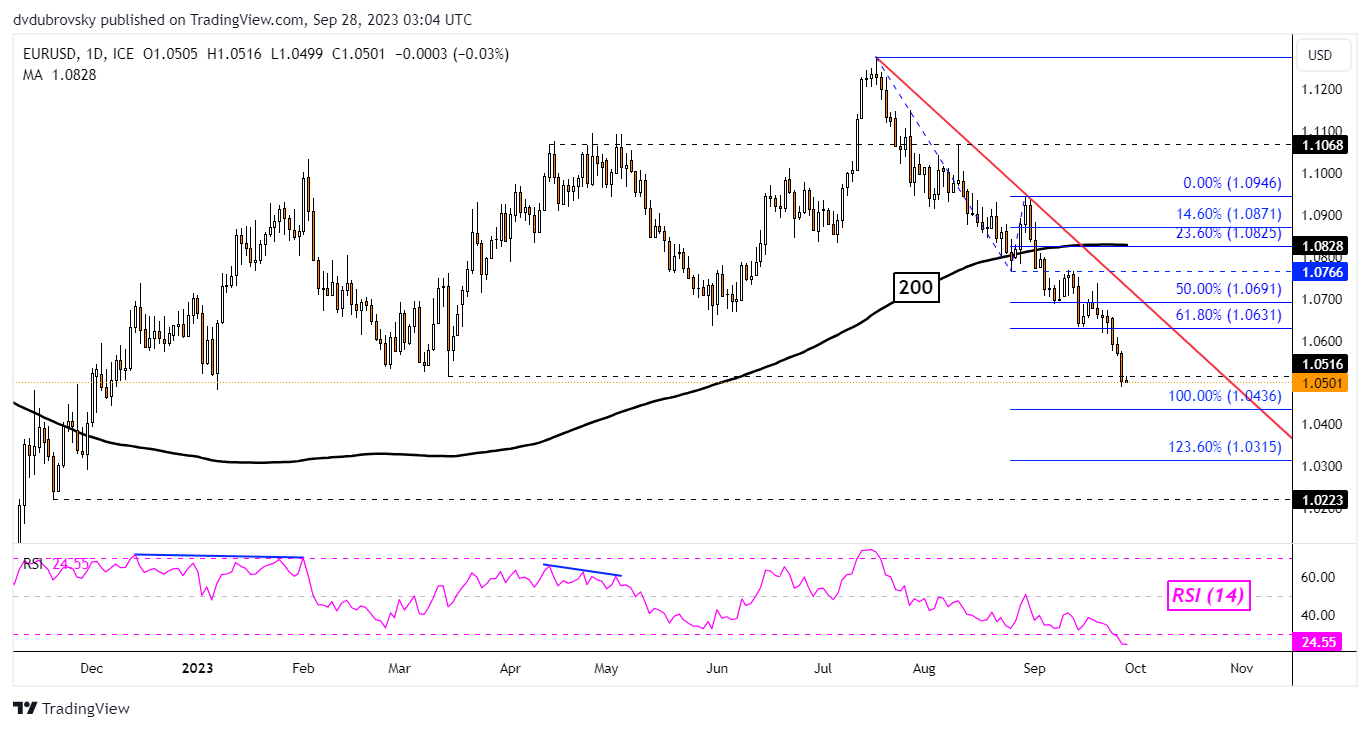
Chart Created in TradingView
Meanwhile, the Euro might be readying to weaken against the British Pound. On the daily chart below, EUR/GBP appears to be rejecting the 0.8658 – 0.8701 resistance zone, opening the door to falling back to the familiar 0.8493 – 0.8519 support range. Broadly, the exchange rate has been consolidating between these two areas in directionless trade.
This also follows a hold and rejection of the 200-day Moving Average. Confirming a push lower places the focus on immediate support which is the 0.861 inflection point. At the same time, the falling trendline from February appears to be holding. Otherwise, breaking above the zone of resistance would introduce a bullish posture, exposing the 61.8% Fibonacci retracement level at 0.8493.
| Change in | Longs | Shorts | OI |
| Daily | 10% | -9% | -1% |
| Weekly | 0% | 34% | 16% |
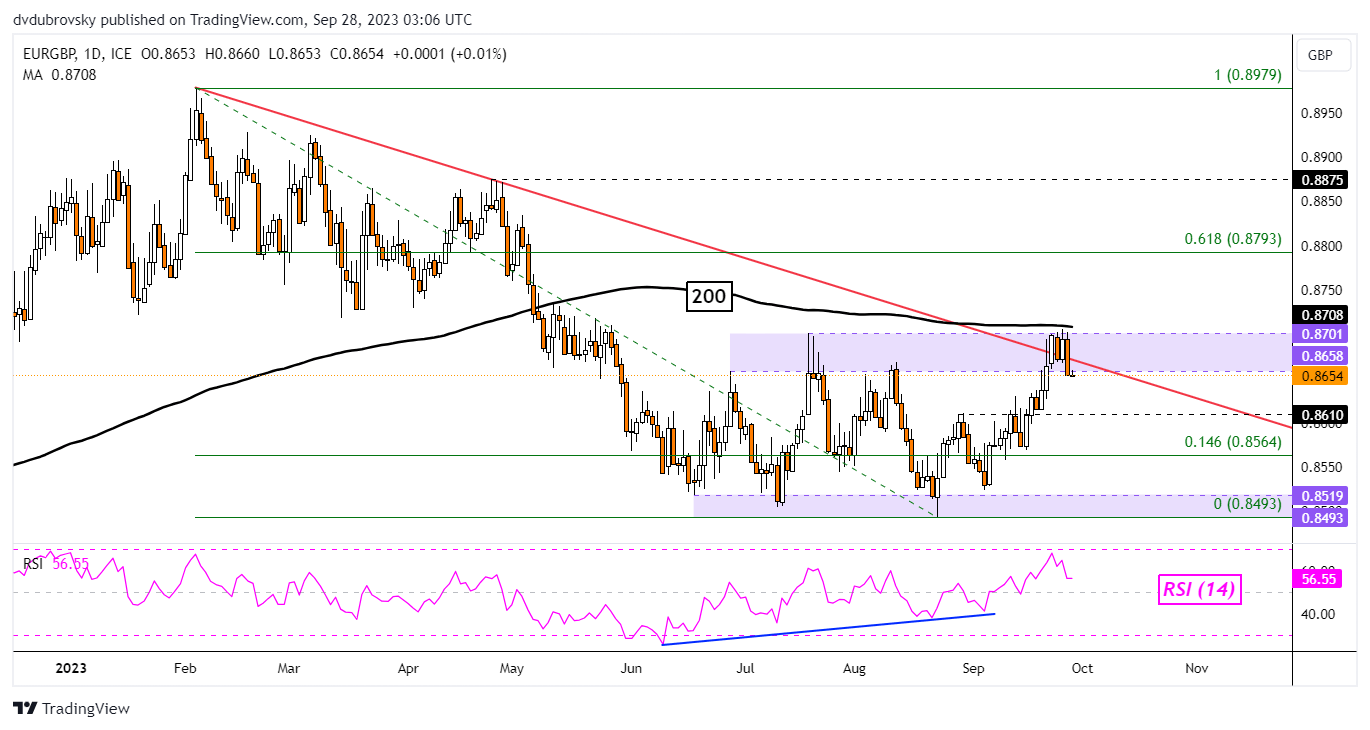
Chart Created in TradingView
— Written by Daniel Dubrovsky, Senior Strategist for DailyFX.com

 آموزش مجازی مدیریت عالی و حرفه ای کسب و کار DBA


ارسال نظر شما
مجموع نظرات : 0 در انتظار بررسی : 0 انتشار یافته : 0