

Gold, Retail Trader Positioning, Technical Analysis – IGCS Update
- Gold 2-week drop at -5.3%, most since early July
- Retail traders keep increasing bullish exposure
- This continues to support a bearish contrarian bias
Recommended by Daniel Dubrovsky
Get Your Free Gold Forecast
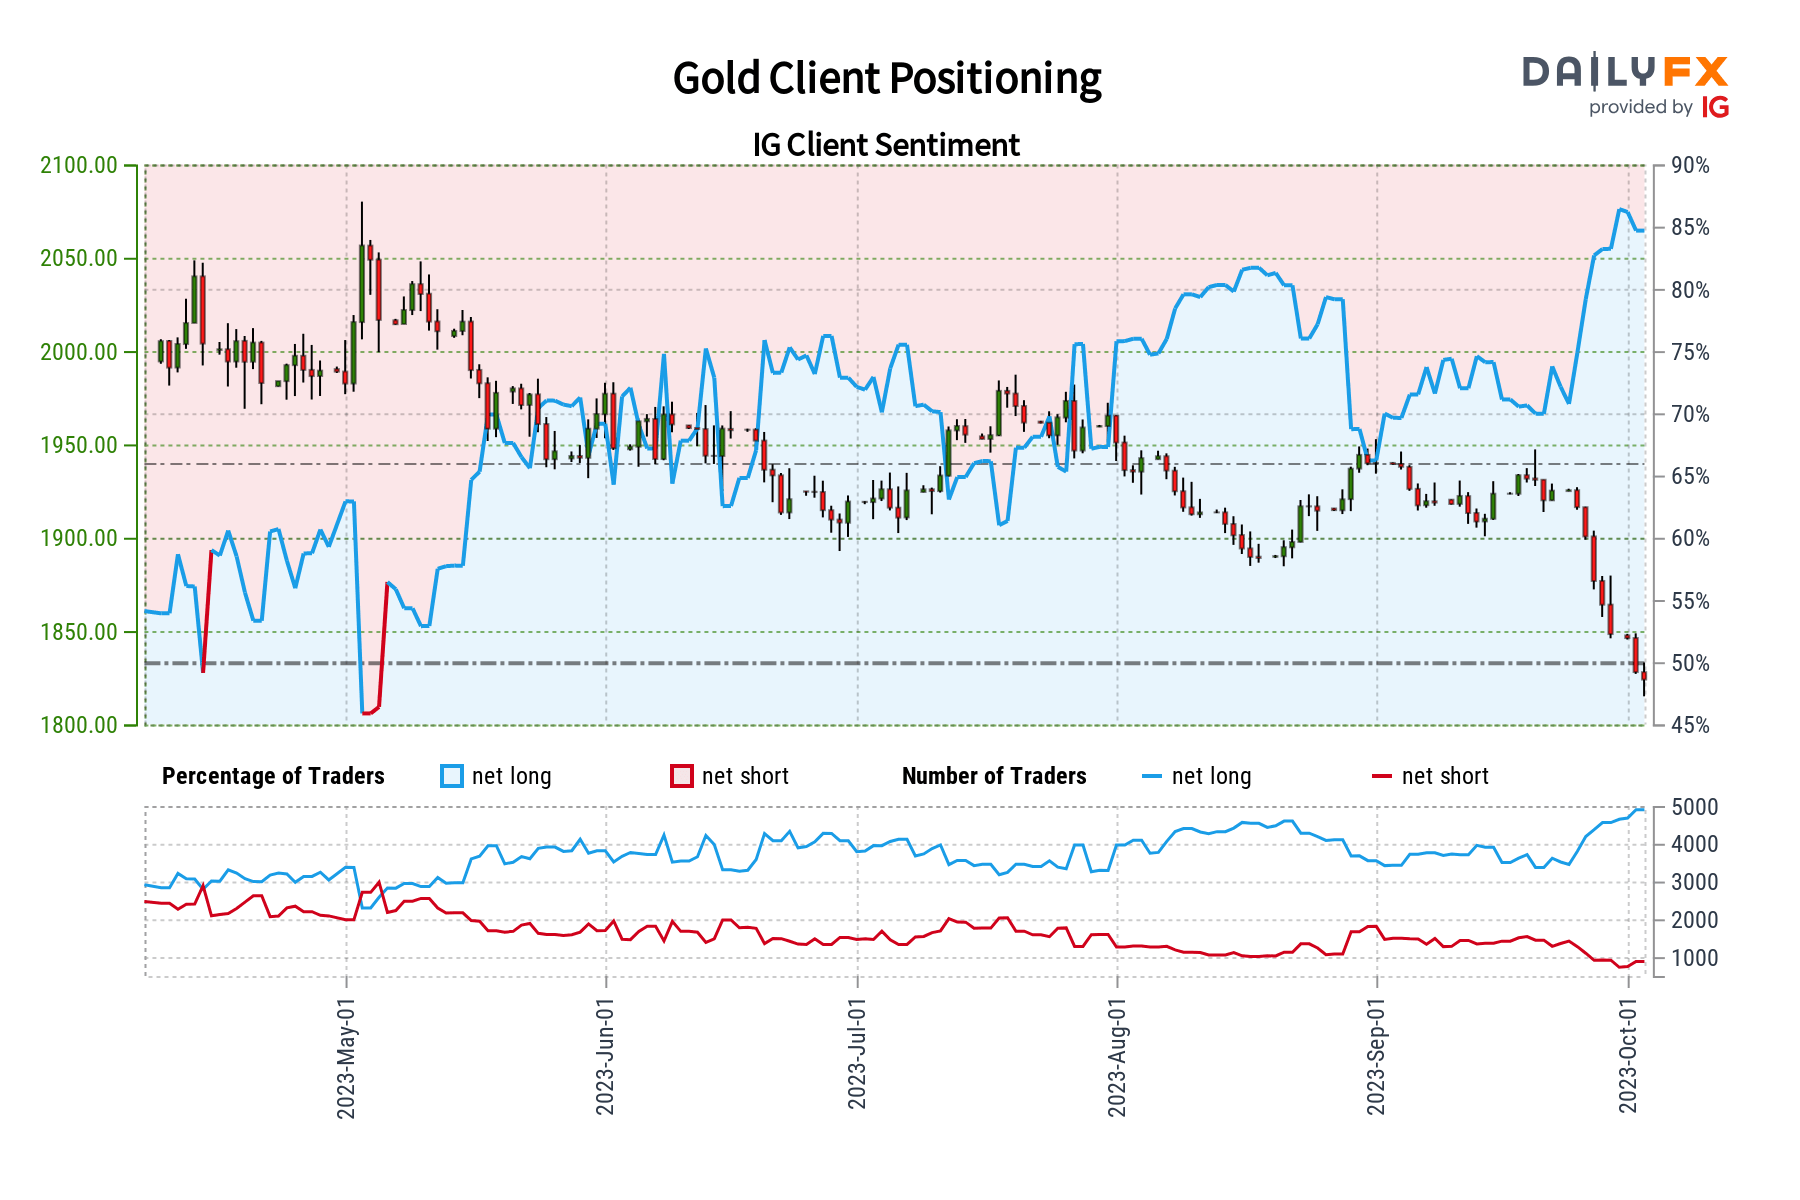
So far, over the past 2 weeks, gold prices have sunk about -5.3 percent. This is setting the stage for the worst 10-day period for XAU/USD since early July. In response, retail traders continue to increase their bullish exposure in the yellow metal. This can be seen by taking a look at IG Client Sentiment (IGCS), which often functions as a contrarian indicator. With that in mind, will gold continue lower?
Gold Sentiment Outlook – Bearish
The IGCS gauge shows that about 75% of retail traders are net-long gold. Since most of them remain biased to the upside, this continues to hint that prices may fall down the road. This is as upside bets increased by 0.6% and 2.25% compared to yesterday and last week, respectively. With that in mind, the combination of overall positioning and recent changes produces a stronger bearish outlook.
| Change in | Longs | Shorts | OI |
| Daily | 6% | -3% | 5% |
| Weekly | 20% | -22% | 12% |
XAU/USD Daily Chart
On the daily chart, gold has confirmed a breakout under the midpoint of the Fibonacci retracement level of 1848.37. This followed a push under near-term rising support from February and a bearish Death Cross between the 50- and 200-day moving averages. Now, immediate support appears to be the February low of 1804.78.
Breaking lower exposes the 78.6% Fibonacci retracement level of 1714.83 on the way towards the 1614 – 1628 support zone, which was established towards the end of last year. Meanwhile, if prices turn higher this places the focus back on 1848 before the 1884 inflection point comes into focus.
Recommended by Daniel Dubrovsky
How to Trade Gold
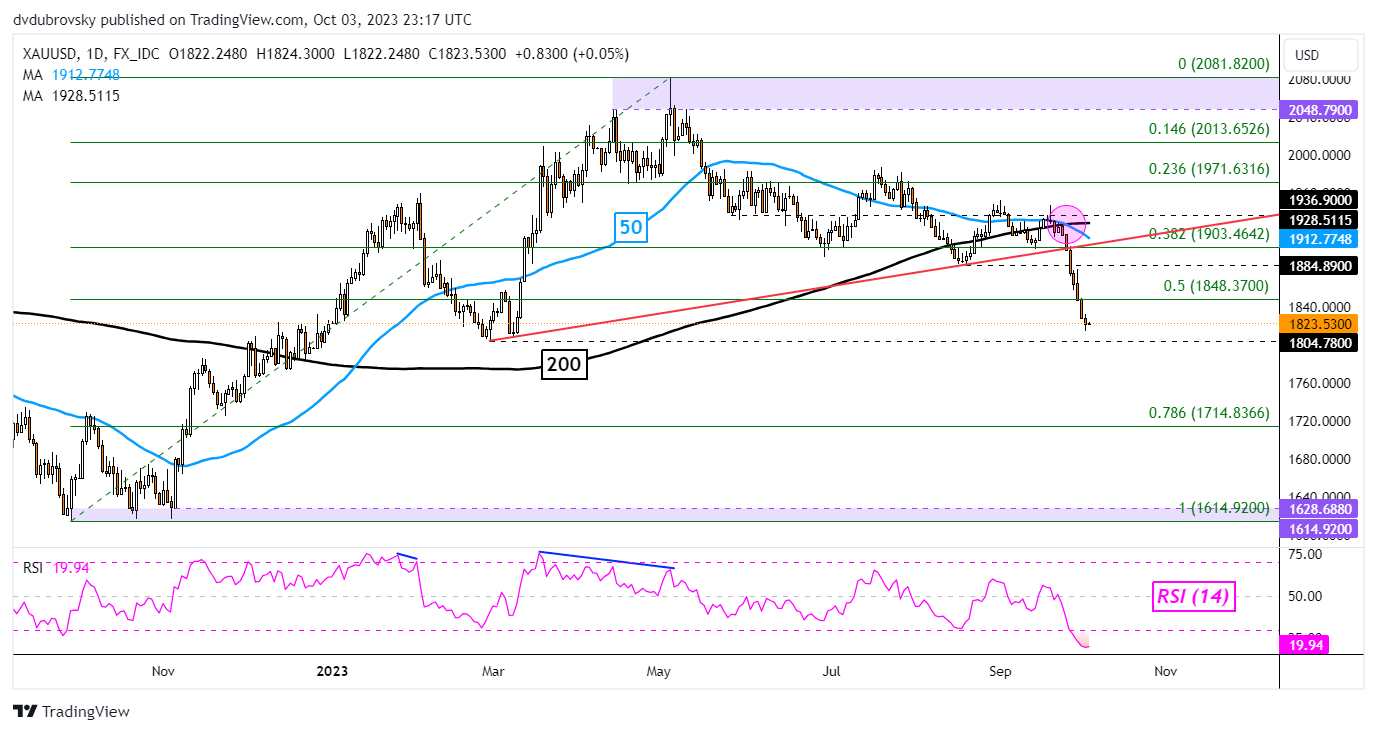
Chart Created in Trading View
— Written by Daniel Dubrovsky, Senior Strategist for DailyFX.com

 آموزش مجازی مدیریت عالی و حرفه ای کسب و کار DBA


ارسال نظر شما
مجموع نظرات : 0 در انتظار بررسی : 0 انتشار یافته : 0