

Crude Oil, WTI, Retail Trader Positioning, Technical Analysis – IGCS Commodities Update
- Crude oil prices close at highest since mid-November
- Retail traders continue to become increasingly bearish
- Now, WTI faces the 61.8% Fibonacci extension point
Recommended by Daniel Dubrovsky
Get Your Free Oil Forecast
Crude oil prices are on pace to rise over 1.8 percent this week so far, with WTI also aiming for a 4th consecutive monthly gain. In response, we can see that retail traders have been becoming increasingly bearish the commodity. This can be seen by taking a look at IG Client Sentiment (IGCS), which often functions as a contrarian indicator. With that in mind, will oil continue higher next?
Crude Oil Sentiment Outlook – Bullish
According to IGCS, only 37% of retail traders are net-long crude oil. Since the majority of them are biased to the downside, this hints prices may continue rising down the road. This is as downside exposure increased by 10.17% and 12.70% compared to yesterday and last week, respectively. With that in mind, the combination of overall exposure and recent changes offers a stronger bullish contrarian outlook.
| Change in | Longs | Shorts | OI |
| Daily | -2% | 10% | 5% |
| Weekly | -2% | 18% | 10% |
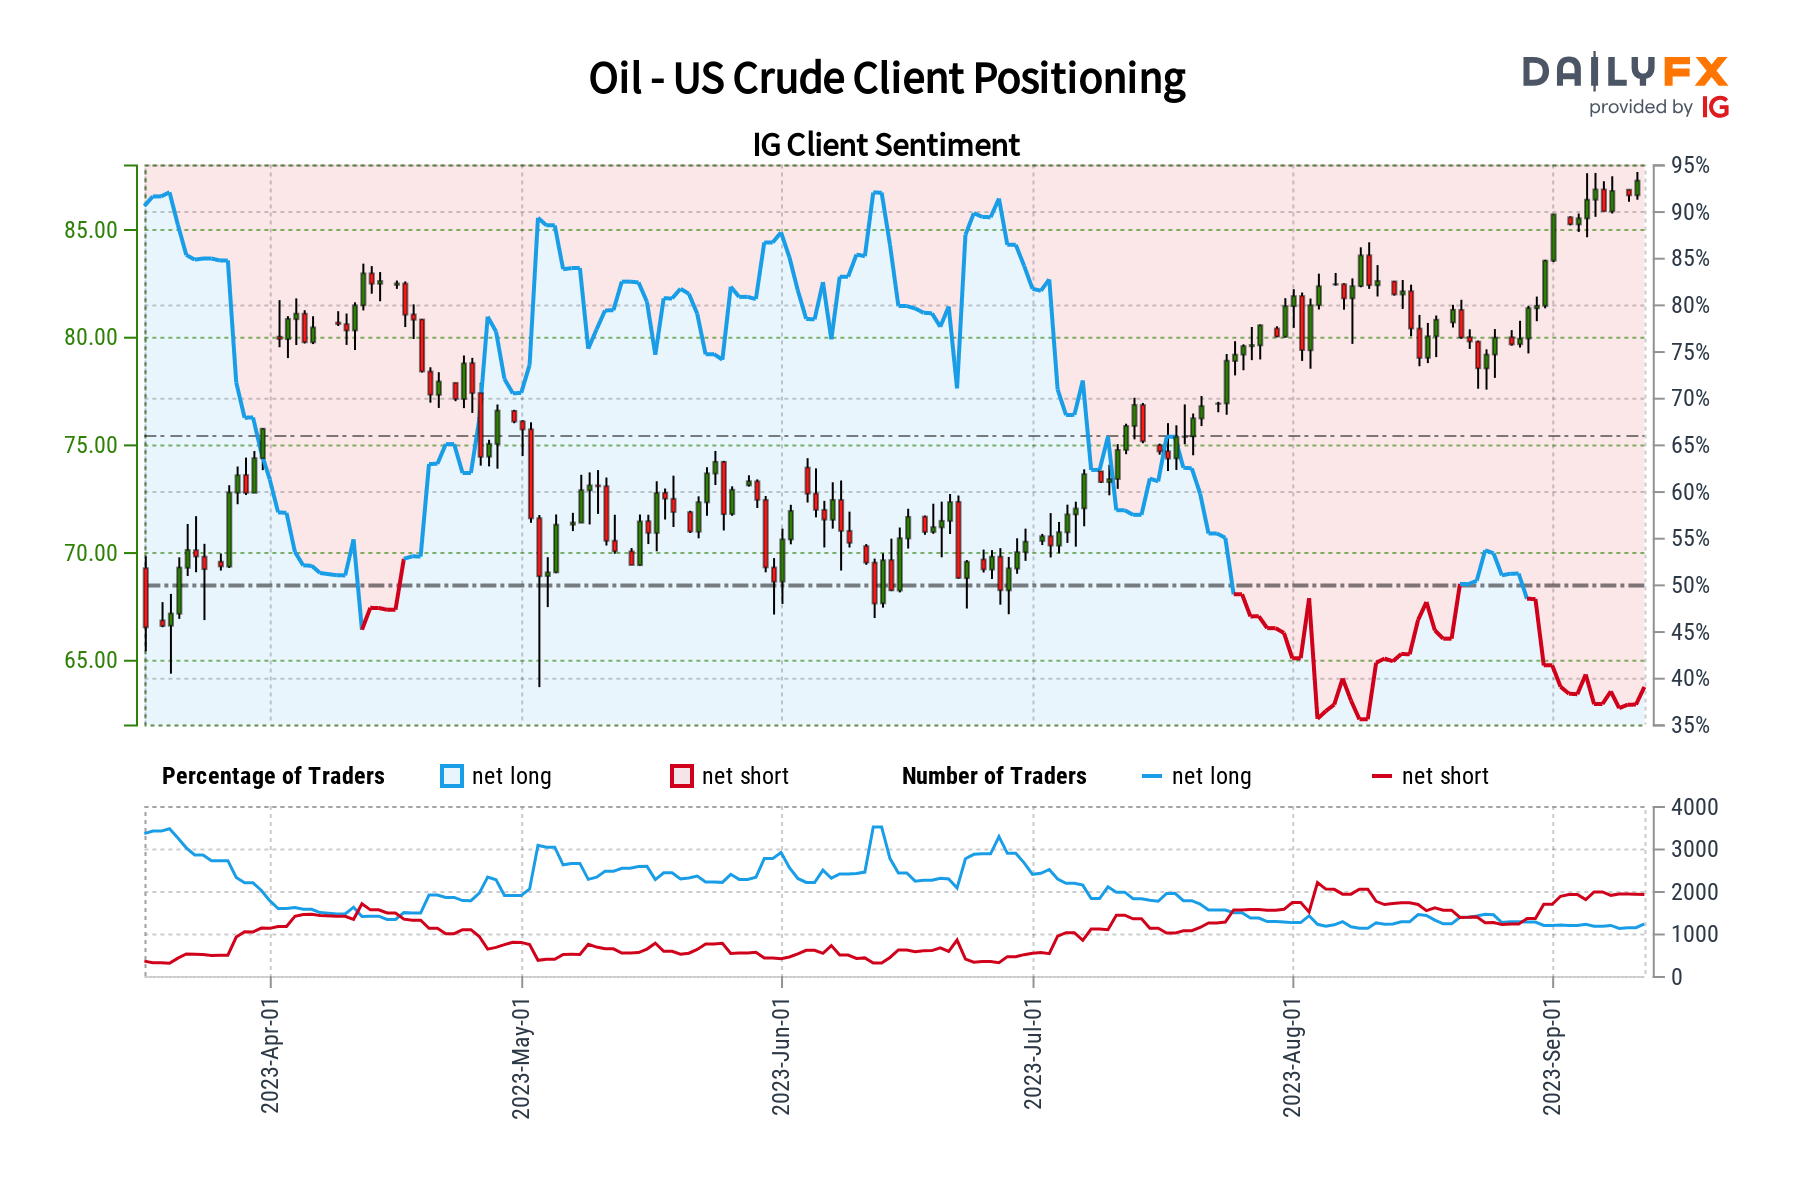
On the daily chart below, WTI has closed above a string of highs set over the past few days, reaching the highest since the middle of November. The push higher has also brought WTI to the 61.8% Fibonacci extension level at 88.75, which is immediate resistance. A confirmatory breakout higher exposes the 92.43 – 93.72 resistance zone from October.
That would open the door to an increasingly stronger bullish technical conviction. Meanwhile, immediate support seems to be the 84.84 inflection point from August. Just below that is the 50-day Moving Average, which could reinstate the broader upside focus in the event of a stronger dip lower.
Recommended by Daniel Dubrovsky
How to Trade Oil
Crude Oil Daily Chart
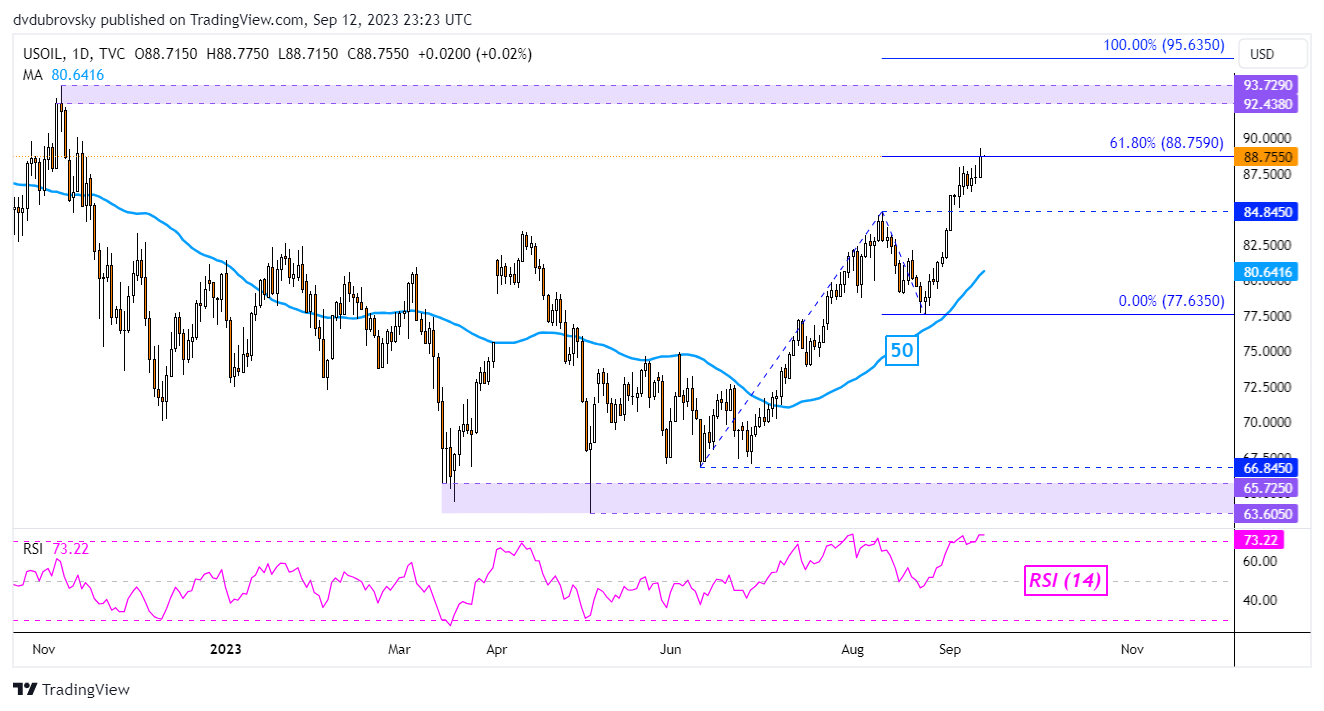
Chart Created in Trading View
— Written by Daniel Dubrovsky, Senior Strategist for DailyFX.com

 آموزش مجازی مدیریت عالی و حرفه ای کسب و کار DBA


ارسال نظر شما
مجموع نظرات : 0 در انتظار بررسی : 0 انتشار یافته : 0