

Canadian Dollar, USD/CAD, Technical Analysis, Retail Trader Positioning – IGCS Update
- Canadian Dollar heading for worst 2-weeks since mid-February
- Meanwhile, retail traders continue to increase downside exposure
- USD/CAD achieves key bullish breakout, but momentum fading
Recommended by Daniel Dubrovsky
Get Your Free USD Forecast
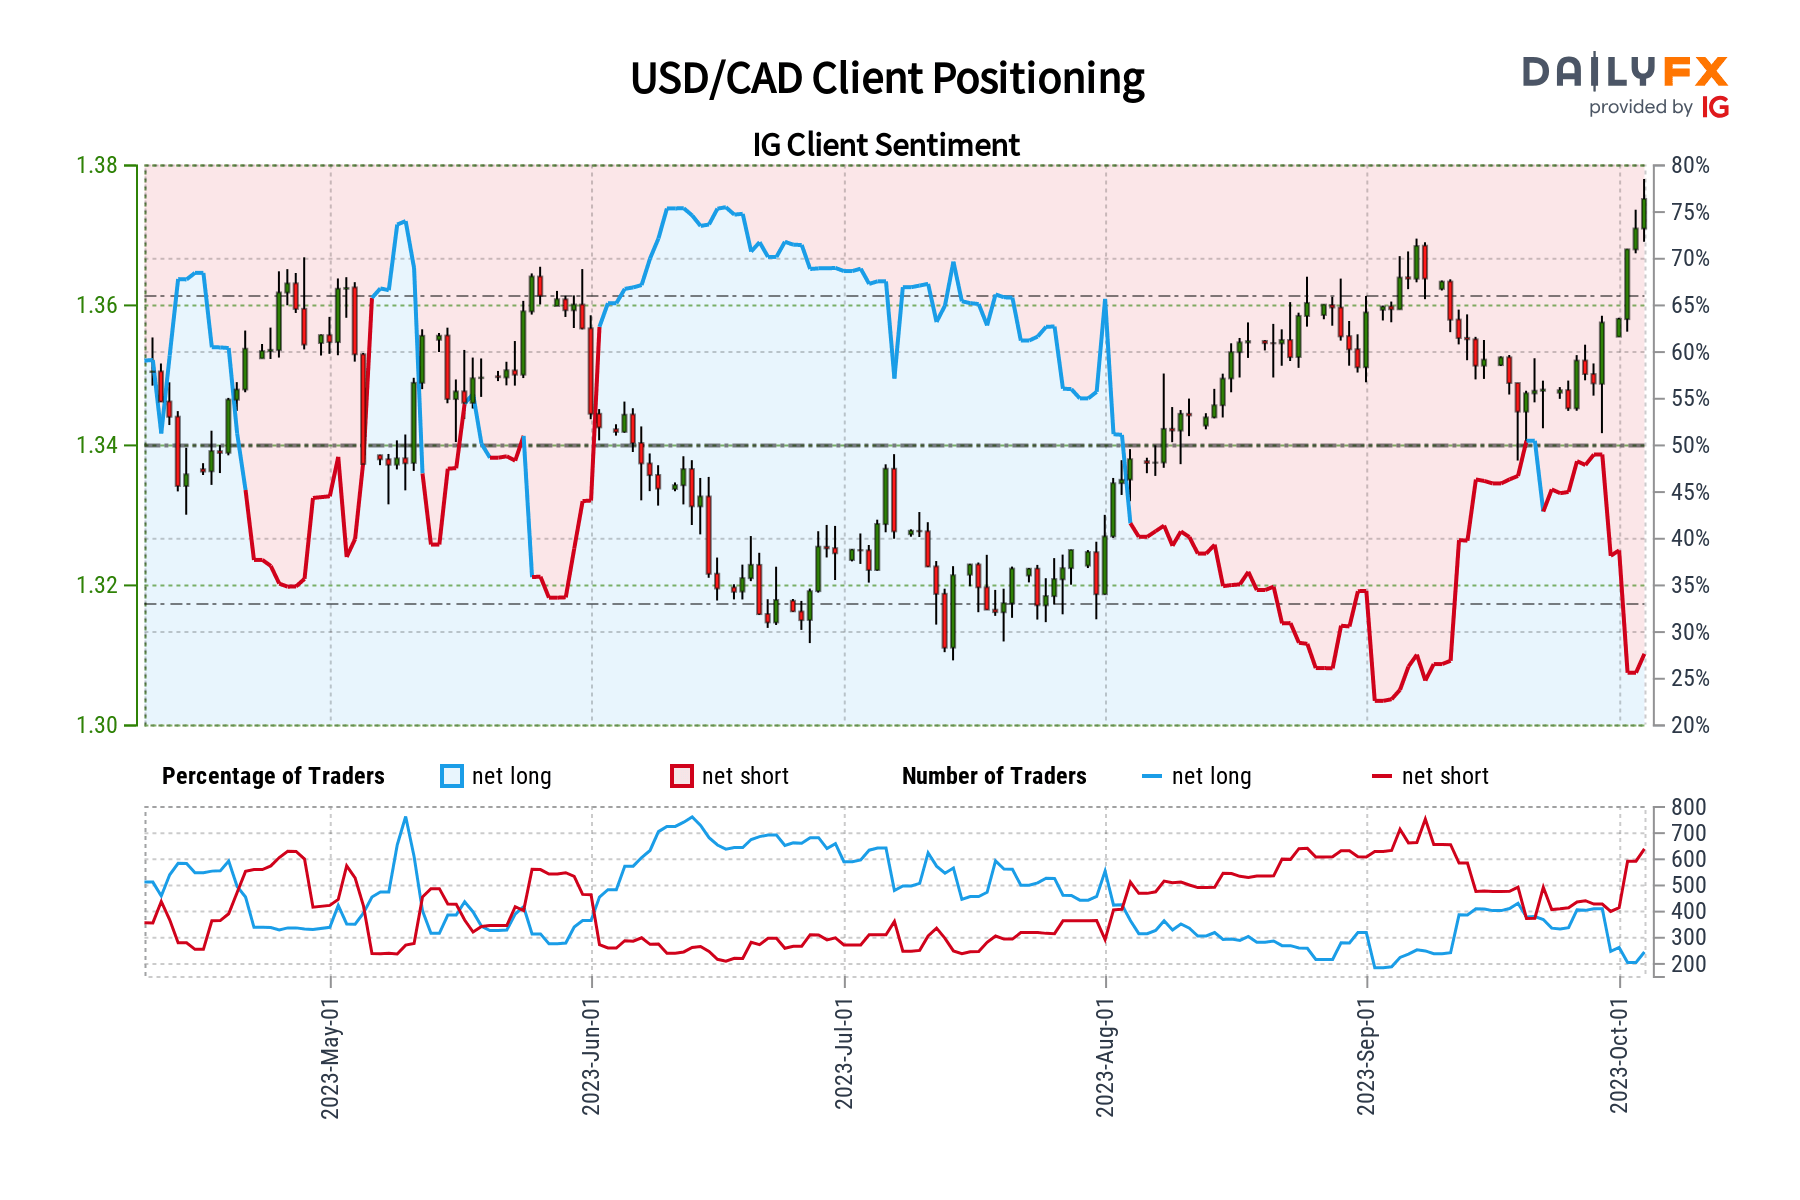
The Canadian Dollar is heading towards its worst 2-week period against the US Dollar since the middle of February with USD/CAD up about 1.8 percent so far. Retail traders have been responding by increasing downside exposure, which can be seen by looking at IG Client Sentiment (IGCS). The latter often functions as a contrarian indicator. With that in mind, will USD/CAD continue higher from here?
USD/CAD Sentiment Outlook – Bullish
The IGCS gauge shows that only about 27% of retail traders are net-long USD/CAD. Since most of them are biased to the downside, this suggests that prices may continue falling down the road. This is as downside exposure increased by 1.77% and 29.04% compared to yesterday and last week, respectively. With that in mind, the combination of recent changes and overall exposure offers a stronger bullish outlook.
| Change in | Longs | Shorts | OI |
| Daily | -14% | -2% | -6% |
| Weekly | -47% | 44% | -2% |
Canadian Dollar Daily Chart
On the daily chart below, USD/CAD has confirmed a breakout above the key 1.3668 inflection zone. The latter has its beginning from earlier this year, around April. Heading into Thursday’s European trading session, the exchange rate is aiming lower. Recent gains have been occurring alongside negative RSI divergence.
This shows that upside momentum is fading, which can at times precede a turn lower. Still, in September, we saw the 50-day Moving Average hold as support, maintaining the broader upside focus. It may very well again in the event of a pronounced drawdown. That would place the focus on the 61.8% Fibonacci retracement level of 1.3568. Otherwise, extending higher turns the focus on the March high of 1.3862.
Recommended by Daniel Dubrovsky
The Fundamentals of Breakout Trading
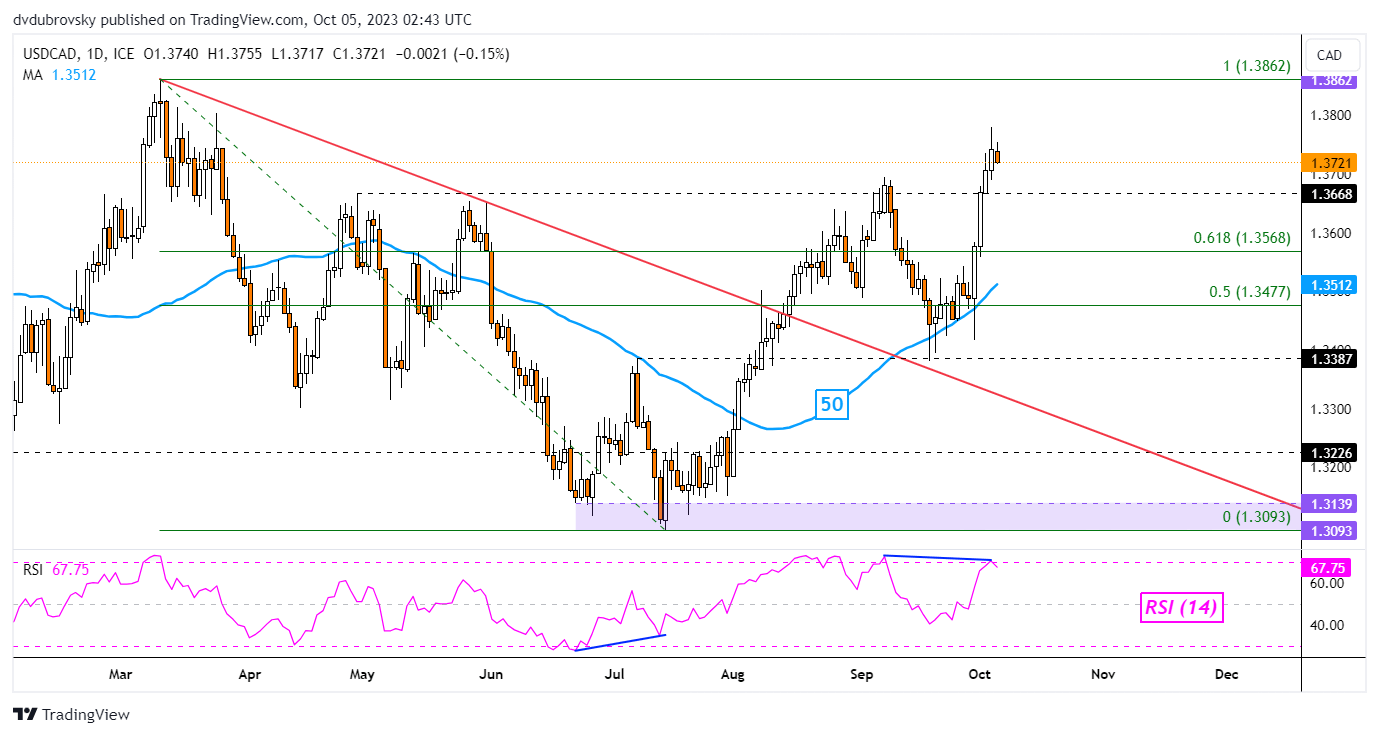
Chart Created in Trading View
— Written by Daniel Dubrovsky, Senior Strategist for DailyFX.com

 آموزش مجازی مدیریت عالی و حرفه ای کسب و کار DBA


ارسال نظر شما
مجموع نظرات : 0 در انتظار بررسی : 0 انتشار یافته : 0