Article by IG Chief Market Analyst Chris Beauchamp
Dow Jones, Nasdaq 100, Nikkei 225 Analysis and Charts
Dow steady above 50-day MA
US markets return from their break, with the Dow’s bounce having stalled since last week. Friday’s session witnessed the index attempting to push higher but running out of momentum. So far it is holding above the 50-day SMA, but a close below 34,700 might prompt a deeper reversal, towards the 100-day SMA.
Bulls will want to see a close back above 35,000 to provide some positive short-term momentum and to open the way to the July highs.
Dow Jones Daily Chart
See How IG Client Sentiment Looks for the Dow Jones
| Change in | Longs | Shorts | OI |
| Daily | 6% | -1% | 2% |
| Weekly | -4% | 3% | 0% |
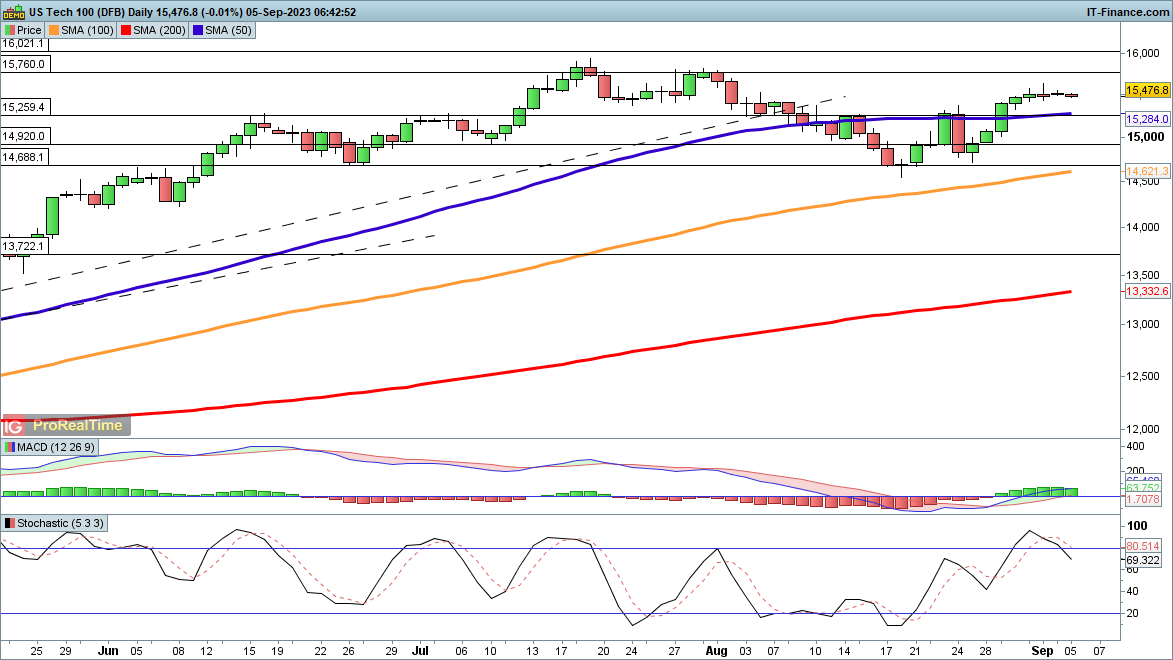
Nasdaq 100 drifts lower in early trading
Gains have also stalled for this index, though the uptrend remains firmly intact.Additional upside targets the late July high at 15,760, and then on to the mid-July high at 15,925. Beyond this, the next major level is the record high at 16,630 from the end of 2021.
For the moment the buyers still have the upper hand, but a close back below the 50-day SMA might signal a pullback towards the August low at 14,670.
Nasdaq 100 Daily Chart

Recommended by IG
Building Confidence in Trading
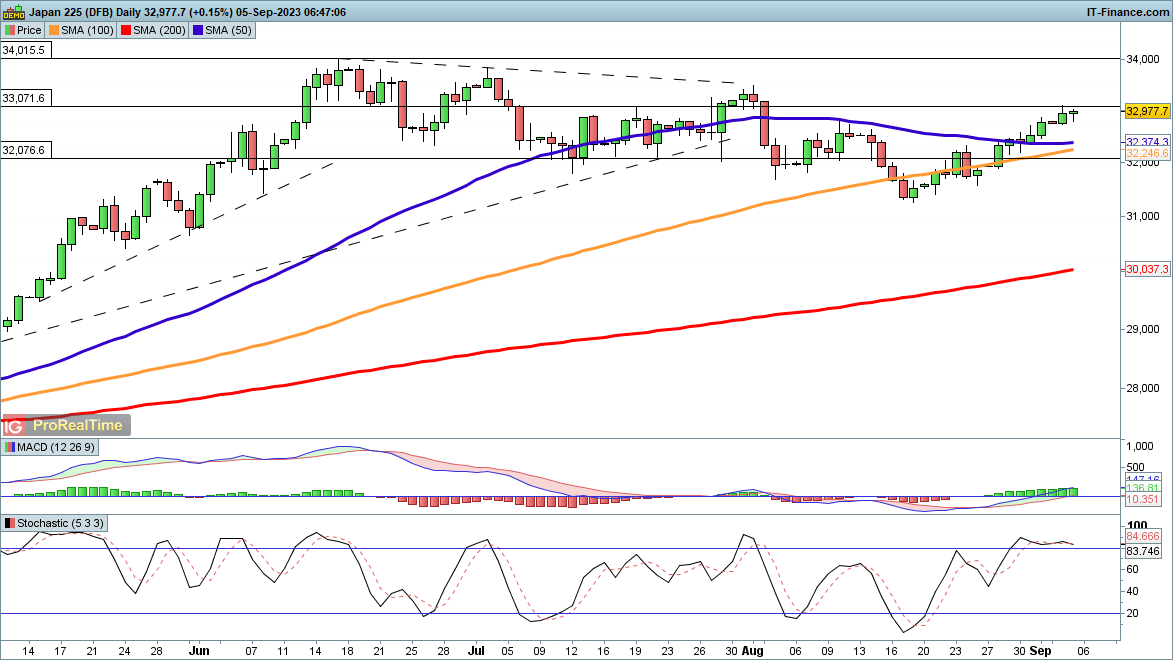
Nikkei 225 sitting just below 33,000
Japanese stocks continue to show strength, continuing to push higher despite the US holiday yesterday.Initial gains target the late July high at 33,430, with a close above here helping to solidify the view that the pullback from the June high has run its course.
A move back below 32,400 might indicate that the sellers have reasserted control.
Nikkei 225 Daily Chart


 آموزش مجازی مدیریت عالی و حرفه ای کسب و کار DBA


ارسال نظر شما
مجموع نظرات : 0 در انتظار بررسی : 0 انتشار یافته : ۰