
 Sell-Off Continues after US Treasury Yields Collapse")
US Dollar Forecast – Prices, Charts, and Analysis
- Market traders now see 100bps of US rate cuts next year.
- Greenback trying to stem further losses.
Recommended by Nick Cawley
Get Your Free USD Forecast
The US dollar is back at lows last seen six weeks ago after last week’s heavy sell-off. US Treasury yields collapsed late last week after the latest FOMC decision and a weak US Jobs Report fueled expectations that US rates have peaked.
US Breaking News: NFP Disappointment Sinks USD, Gold Bid
DailyFX Calendar
The latest CME FedWatch Tool suggests that US interest rates will be left unchanged at the next three meetings and now assign a 40% chance of a 25 basis point rate cut at the May FOMC meeting, followed by another three similar rate cuts during the year.
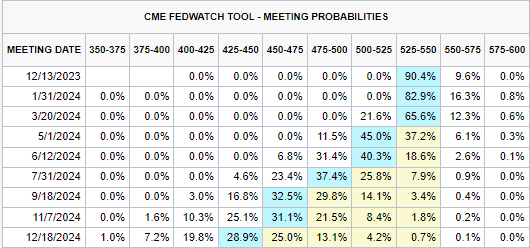
CME FedWatch Tool
Recommended by Nick Cawley
The Fundamentals of Breakout Trading
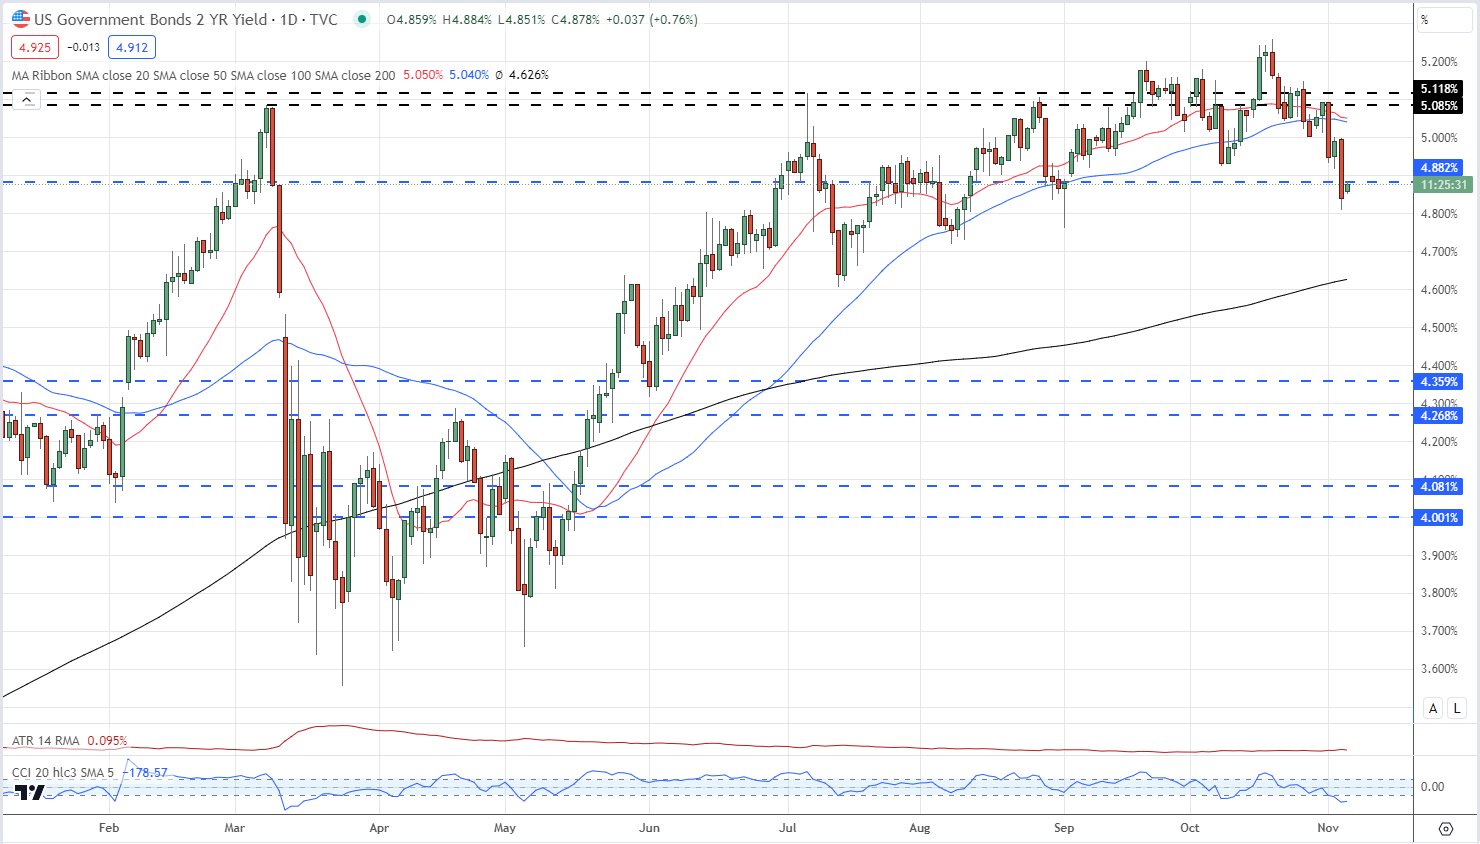
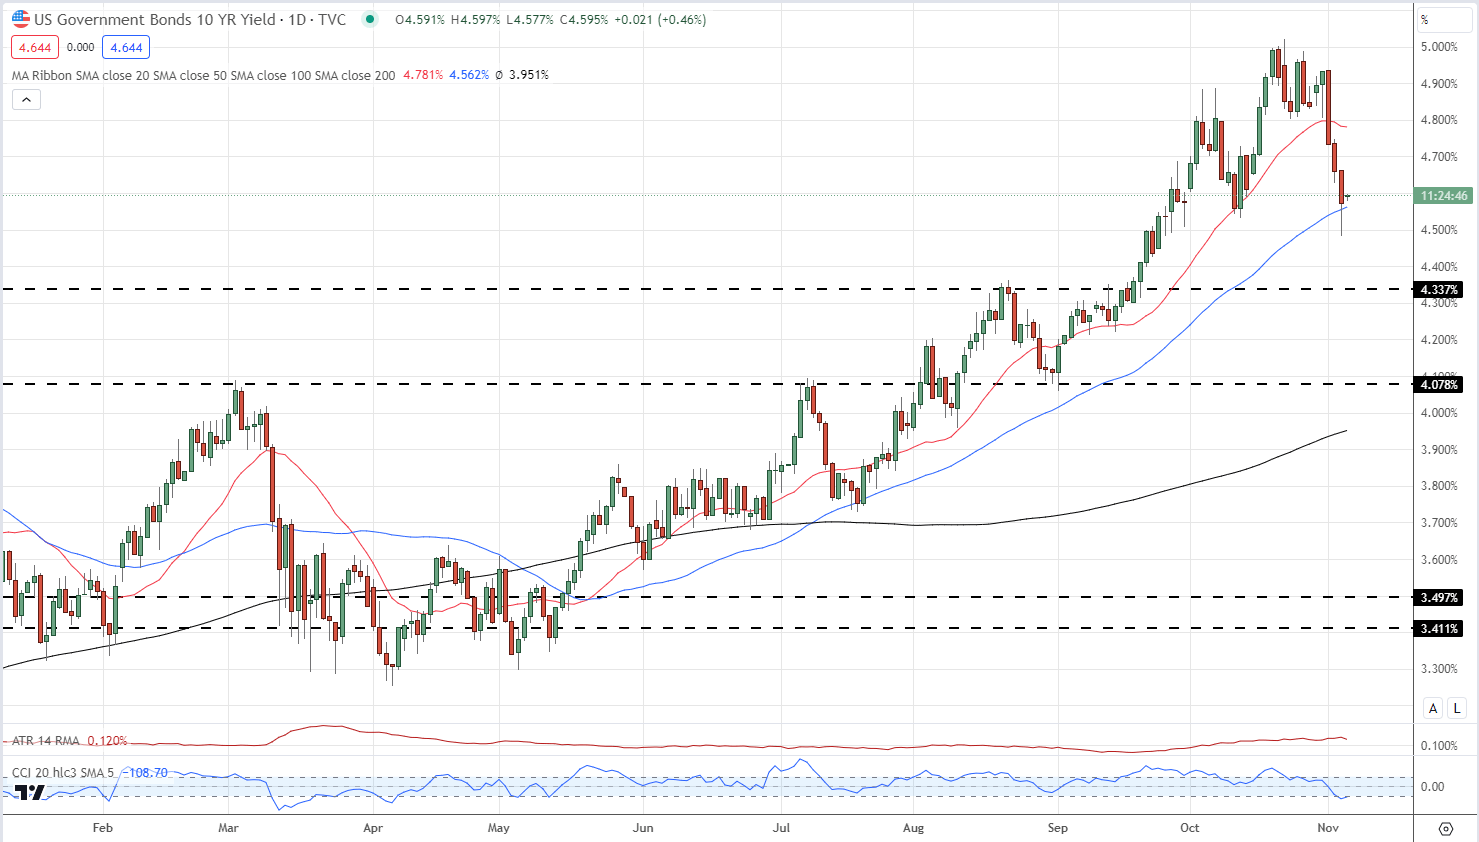
This shift in expectations can be clearly seen in the US Treasury market over the last four sessions with both short- and long-dated yields falling sharply. The rate-sensitive US 2-year hit a multi-year high of 5.26% on October 19th – it now trades with a yield of 4.87%. Further along the curve the 10-year trades at 4.59%, compared to a recent high of 5.02%, while the 30-year is offered at 4.77% against a peak rate of 5.18%.
US 2-Year Yield Daily Chart
US 10-Year Yield Daily Chart
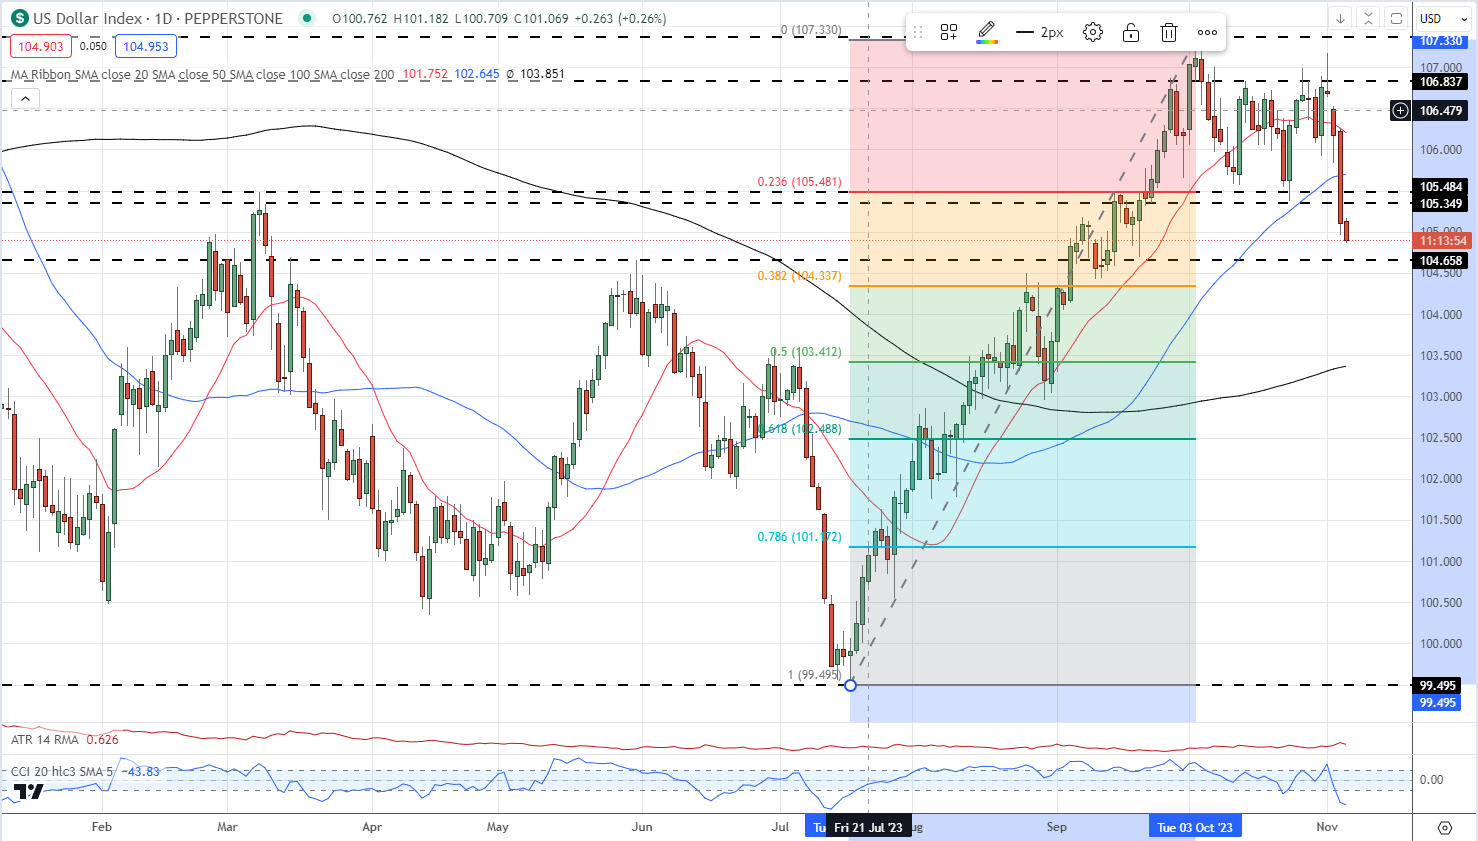
The recent sell-off in the US dollar has turned the technical outlook negative. The dollar is now trading below both the 20- and 50-day simple moving averages and has opened below an old level of support on either side of 105.40. The area now turns into resistance. Horizontal support at 104.66 may not hold a concerted sell-off, leaving the 38.2% Fibonacci retracement level at 104.34 vulnerable.
US Dollar Index Daily Price Chart – November 6, 2023
All Charts via TradingView
What is your view on the US Dollar – bullish or bearish?? You can let us know via the form at the end of this piece or you can contact the author via Twitter @nickcawley1.

 آموزش مجازی مدیریت عالی و حرفه ای کسب و کار DBA


ارسال نظر شما
مجموع نظرات : 0 در انتظار بررسی : 0 انتشار یافته : 0