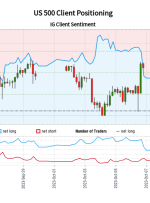
Number of traders net-short has increased by 27.78% from last week. SYMBOL TRADING BIAS NET-LONG% NET-SHORT% CHANGE IN LONGS CHANGE IN SHORTS CHANGE IN OI US 500 BULLISH 49.05% 50.95% -9.57% Daily -19.17% Weekly 11.44% Daily 27.78% Weekly 0.04% Daily -0.55% Weekly of clients are net long. of clients are net short. Change in Longs
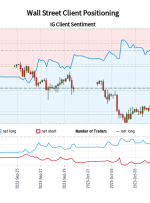
Number of traders net-short has increased by 31.75% from last week. SYMBOL TRADING BIAS NET-LONG% NET-SHORT% CHANGE IN LONGS CHANGE IN SHORTS CHANGE IN OI Wall Street BULLISH 48.45% 51.55% -9.95% Daily -32.88% Weekly 13.96% Daily 31.75% Weekly 0.97% Daily -10.16% Weekly of clients are net long. of clients are net short. Change in Longs
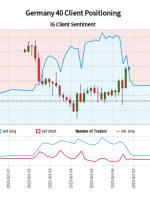
Number of traders net-short has increased by 21.11% from last week. SYMBOL TRADING BIAS NET-LONG% NET-SHORT% CHANGE IN LONGS CHANGE IN SHORTS CHANGE IN OI Germany 40 BULLISH 48.32% 51.68% 0.83% Daily -11.86% Weekly 29.70% Daily 21.11% Weekly 13.94% Daily 2.57% Weekly of clients are net long. of clients are net short. Change in Longs
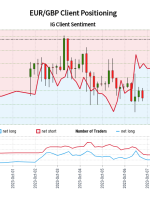
Number of traders net-short has decreased by 10.45% from last week. SYMBOL TRADING BIAS NET-LONG% NET-SHORT% CHANGE IN LONGS CHANGE IN SHORTS CHANGE IN OI EUR/GBP BEARISH 51.31% 48.69% 12.46% Daily -0.89% Weekly -1.86% Daily -10.45% Weekly 5.00% Daily -5.79% Weekly of clients are net long. of clients are net short. Change in Longs Shorts
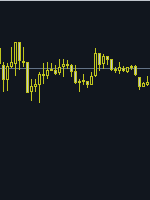
Good evening. Today I traded on the signals of my indicator. Trading the EURCAD pair on the M15 timeframe. Great result, today I earned $ 37. Buy signal: up arrow. If there are open sell positions, they need to be closed. Sell signal: downward arrow. If there are open buy positions, they need to be closed. There are situations when several signals
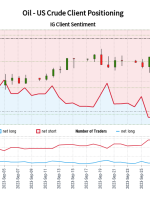
Number of traders net-short has decreased by 40.19% from last week. SYMBOL TRADING BIAS NET-LONG% NET-SHORT% CHANGE IN LONGS CHANGE IN SHORTS CHANGE IN OI Oil – US Crude BEARISH 51.94% 48.06% 10.99% Daily 44.11% Weekly -11.17% Daily -40.19% Weekly -0.89% Daily -14.09% Weekly of clients are net long. of clients are net short. Change
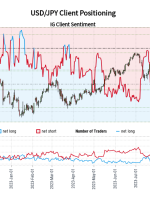
Number of traders net-short has increased by 0.38% from last week. SYMBOL TRADING BIAS NET-LONG% NET-SHORT% CHANGE IN LONGS CHANGE IN SHORTS CHANGE IN OI USD/JPY BULLISH 12.43% 87.57% -40.95% Daily -41.87% Weekly -4.01% Daily 0.38% Weekly -10.94% Daily -7.94% Weekly of clients are net long. of clients are net short. Change in Longs Shorts
Crude Oil, WTI, Retail Trader Positioning, Technical Analysis – IGCS Commodities Update Crude oil prices fell the most over 2 days since early June Retail traders are increasingly building upside exposure This is an early warning sign that WTI may continue lower Recommended by Daniel Dubrovsky Get Your Free Oil Forecast Over the past 2
Gold, Retail Trader Positioning, Technical Analysis – IGCS Update Gold prices extend losses on rising Treasury yields Retail traders are becoming even more bullish XAU With prices extending the downtrend, what are key levels ahead? Recommended by Daniel Dubrovsky Get Your Free Gold Forecast Gold prices have been sinking in recent days, succumbing to a
Number of traders net-short has decreased by 35.23% from last week. SYMBOL TRADING BIAS NET-LONG% NET-SHORT% CHANGE IN LONGS CHANGE IN SHORTS CHANGE IN OI FTSE 100 BEARISH 51.27% 48.73% 25.94% Daily 51.88% Weekly -21.61% Daily -35.23% Weekly -2.79% Daily -8.25% Weekly of clients are net long. of clients are net short. Change in Longs