

Crude Oil, WTI, Retail Trader Positioning, Technical Analysis – IGCS Commodities Update
- Crude oil prices fell the most over 2 days since early June
- Retail traders are increasingly building upside exposure
- This is an early warning sign that WTI may continue lower
Recommended by Daniel Dubrovsky
Get Your Free Oil Forecast
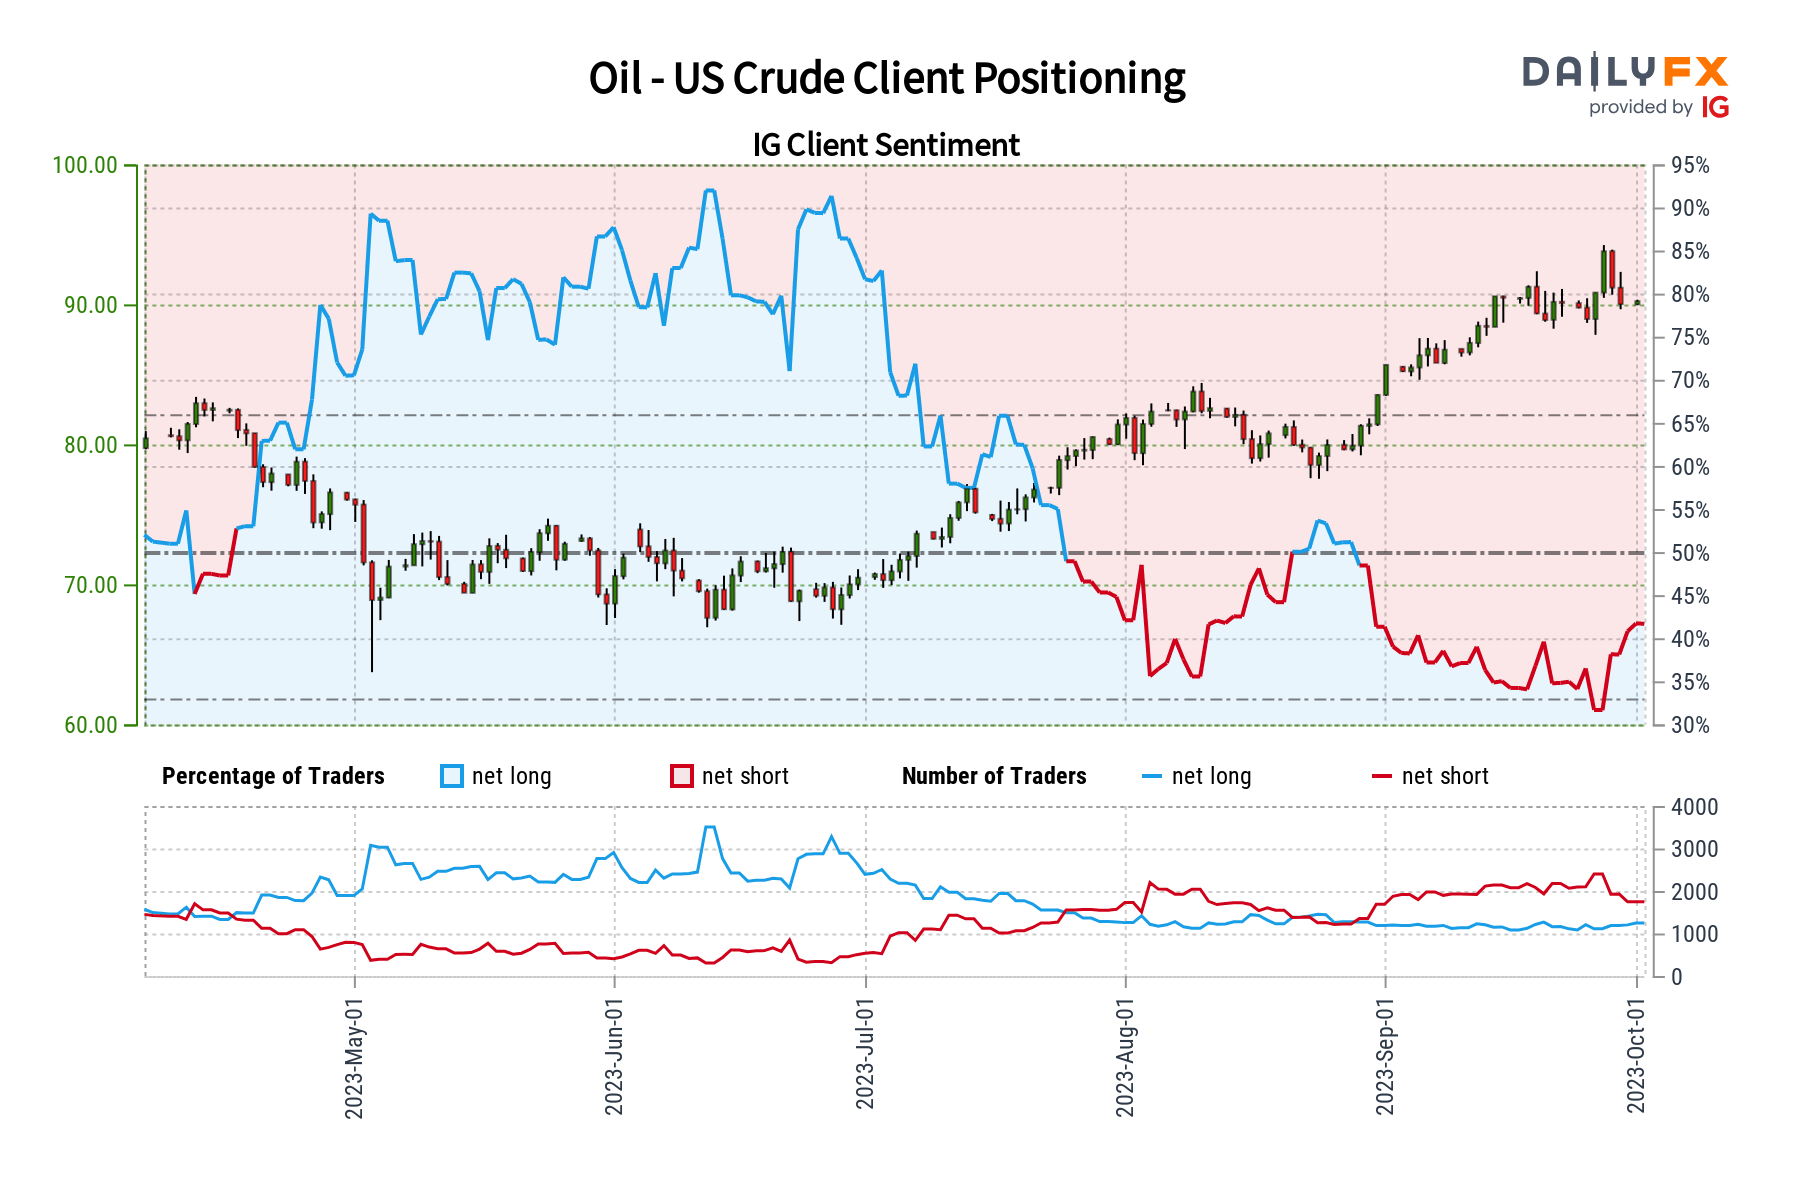
Over the past 2 days, crude oil prices have fallen more than -3.4 percent. This marked the worst 2-day performance since early June. In response, retail traders have begun increasing upside exposure. This can be seen by taking a look at IG Client Sentiment (IGCS), which often works as a contrarian indicator. With that in mind, could further pain be in store for oil next?
Crude Oil Sentiment Outlook – Bearish
According to IGCS, only about 45% of retail traders are net-long crude oil. Since most are still biased to the downside, this continues to suggest price may rise down the road. That said, upside exposure has increased by 8.8% and 11.11% compared to yesterday and last week, respectively. With that in mind, recent changes in bets warn that the current price trend may soon reverse lower.
| Change in | Longs | Shorts | OI |
| Daily | 9% | -6% | 0% |
| Weekly | 11% | -22% | -9% |
On the daily chart below, we can see that WTI has effectively rejected November highs, which make for a zone of resistance between 92.43 – 93.72. This also followed negative RSI divergence, which showed that upside momentum was fading. Since then, prices have extended lower, recently taking out the 20-day moving average.
Oil is also testing a push under the 61.8% Fibonacci extension level at 88.75. Confirming a breakout lower may open the door to an increasingly downward technical bias. Such an outcome places the focus on the 50-day moving average, and the 84.84 inflection point from August. These may hold as support.
Recommended by Daniel Dubrovsky
How to Trade Oil
Crude Oil Daily Chart
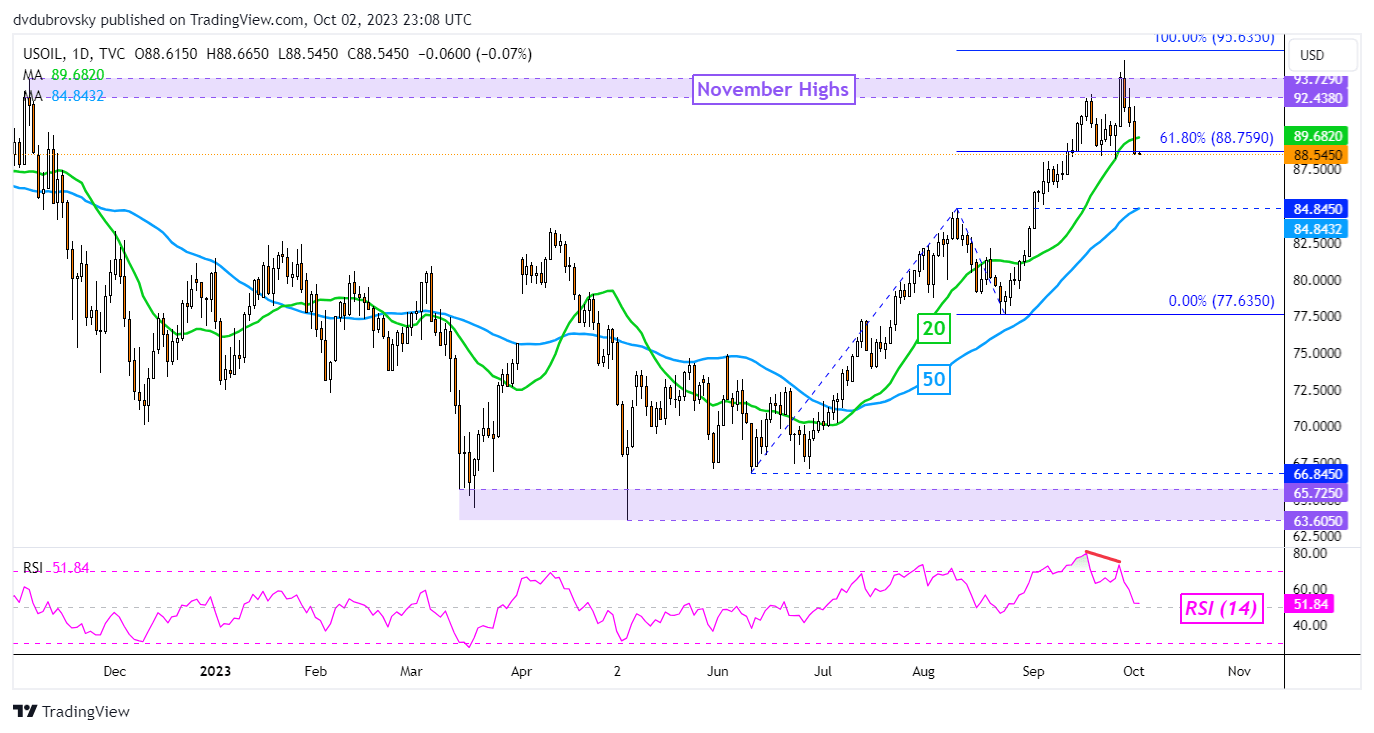
Chart Created in Trading View
— Written by Daniel Dubrovsky, Senior Strategist for DailyFX.com

 آموزش مجازی مدیریت عالی و حرفه ای کسب و کار DBA


ارسال نظر شما
مجموع نظرات : 0 در انتظار بررسی : 0 انتشار یافته : 0