FTSE 100, Dax and Dow all Edge Higher after Recent Heavy Losses​​​​

Article by IG Chief Market Analyst Chris Beauchamp FTSE 100, DAX 40, and Dow Jones 30 Charts and Analysis FTSE 100 back to 7400 ​Friday witnessed the index close below trendline support from the August low and below the early October low.​Further losses now beckon towards 7300 and then down to 7215, the low from

FTSE 100, DAX 40 and Russell 2000 Drop on Risk-Off Sentiment

Article by IG Senior Market Analyst Axel Rudolph FTSE 100, DAX 40, Russell 2000 Analysis and Charts ​​​FTSE 100 falls out of bed on hawkish Fed ​The FTSE 100 once again failed in the 7,700 region and dropped by over 2.5% over the past couple of days as the US Federal Reserve (Fed) re-iterates its

00 GMT when FTSE 100 traded near 7,617.50.

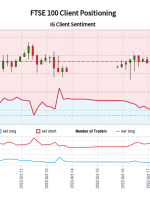
Number of traders net-short has decreased by 23.06% from last week. SYMBOL TRADING BIAS NET-LONG% NET-SHORT% CHANGE IN LONGS CHANGE IN SHORTS CHANGE IN OI FTSE 100 BEARISH 50.60% 49.40% 55.95% Daily 31.67% Weekly -33.41% Daily -23.06% Weekly -6.22% Daily -2.56% Weekly of clients are net long. of clients are net short. Change in Longs

FTSE 100, DAX 40 and Nasdaq Stabilize in Cautious Trading

Written by Axel Rudolph, Senior Market Analyst at IG Elevate your trading skills and gain a competitive edge. Get your hands on the Equities Q4 outlook today for exclusive insights into key market catalysts that should be on every trader’s radar. Recommended by Warren Venketas Get Your Free Equities Forecast FTSE 100 capped by resistance

00 GMT when FTSE 100 traded near 7,504.50.

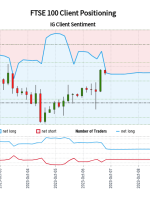
Number of traders net-short has increased by 28.06% from last week. SYMBOL TRADING BIAS NET-LONG% NET-SHORT% CHANGE IN LONGS CHANGE IN SHORTS CHANGE IN OI FTSE 100 BULLISH 48.16% 51.84% -12.32% Daily -23.20% Weekly 25.26% Daily 28.06% Weekly 3.83% Daily -3.09% Weekly of clients are net long. of clients are net short. Change in Longs

FTSE 100, DAX 40 and S&P 500 Trade Within or Close to Key Resistance

Article by IG Senior Market Analyst Axel Rudolph FTSE 100, DAX 40, S&P 500 Analysis and Charts Download our Brand New Q4 Equity Forecast for Free Recommended by IG Get Your Free Equities Forecast ​​​FTSE 100 rallies on dovish Fed view ​​The FTSE 100 has seen four consecutive days of gains as more and more

FTSE 100, DAX 40 and S&P 500 Gap Lower on Middle East Conflict​​​

Article by IG Senior Market Analyst Axel Rudolph FTSE 100, DAX 40, S&P 500 Analysis and Charts Download the Brand New Q4 Equity Outlook Recommended by IG Get Your Free Equities Forecast ​​​FTSE 100 weighed down by eruption of Middle East conflict ​​The FTSE 100, which on Friday reached its 55-day simple moving average (SMA)

FTSE 100, S&P 500 and Russell 2000 Hover Above Support Ahead of US NFP

Article by IG Senior Market Analyst Axel Rudolph FTSE 100, S&P 500, Russell 2000 Analysis and Charts ​​​FTSE 100 tries to recover from one-month low ​ ​The FTSE 100 is seen heading back up towards its 55-day simple moving average (SMA) at 7,521 while awaiting key US employment data.​If overcome, another attempt at reaching the

Nikkei 225, FTSE 100 and S&P 500 Continue to Free Fall​​​

Article by IG Senior Market Analyst Axel Rudolph Nikkei 225, FTSE 100, S&P 500 Analysis and Charts ​​​Nikkei 225 drops to near five-month low ​Since last week the Nikkei 225 dropped by close to 5% as higher yields led to risk-off sentiment. ​The fall through the 200-day simple moving average (SMA) at 30,690.2 amid potential