
Nikkei 225, FTSE 100 and S&P 500 Continue to Free Fall
[ad_1] Article by IG Senior Market Analyst Axel Rudolph Nikkei 225, FTSE 100, S&P 500 Analysis and Charts Nikkei 225 drops to near five-month low Since last week the Nikkei 225 dropped by close to 5% as higher yields led to risk-off sentiment. The fall through the 200-day simple moving average (SMA) at 30,690.2 amid

[ad_1]
Article by IG Senior Market Analyst Axel Rudolph
Nikkei 225, FTSE 100, S&P 500 Analysis and Charts
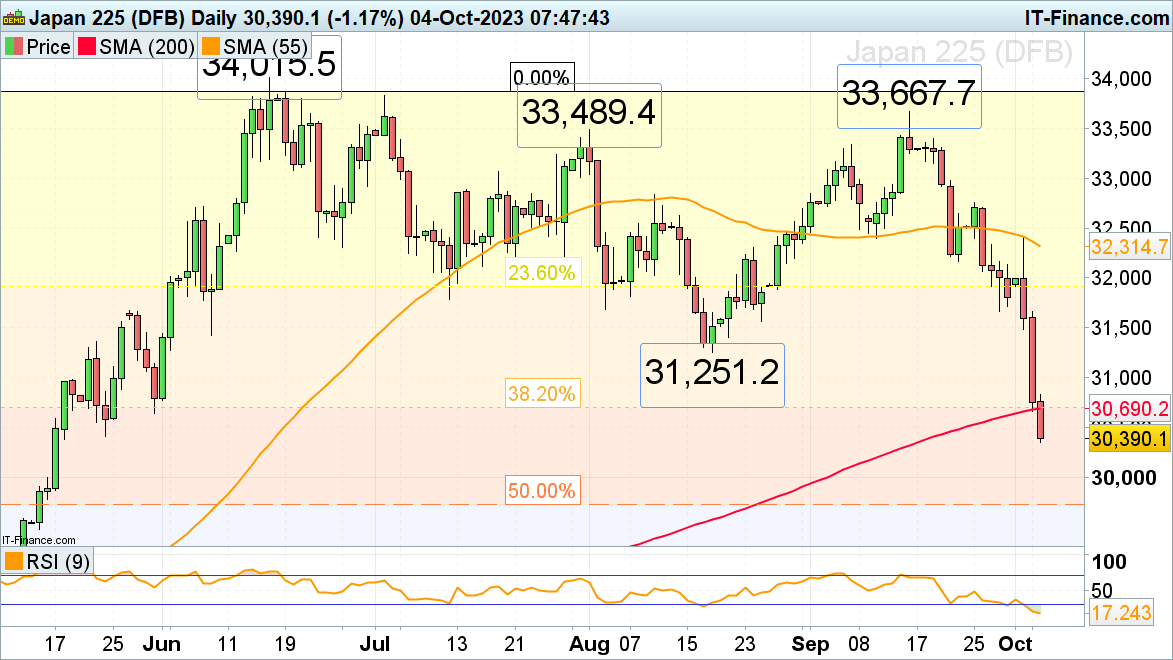
Nikkei 225 drops to near five-month low
Since last week the Nikkei 225 dropped by close to 5% as higher yields led to risk-off sentiment. The fall through the 200-day simple moving average (SMA) at 30,690.2 amid potential currency intervention by the Bank of Japan (BoJ) is worrying for the bulls with the minor psychological 30,000 mark now in focus. Below it lies the 50% retracement of this year’s up to 32% uptrend at 29,730 which represents another possible downside target.
Minor resistance above the 200-day SMA at 30,690.2 sits at the 38.2% Fibonacci retracement at 30,710 and more significant resistance at the 31,251.2 August low.
Nikkei 225 Daily Chart
Download our Brand New Q4 Equities Outlook
Recommended by IG
Get Your Free Equities Forecast
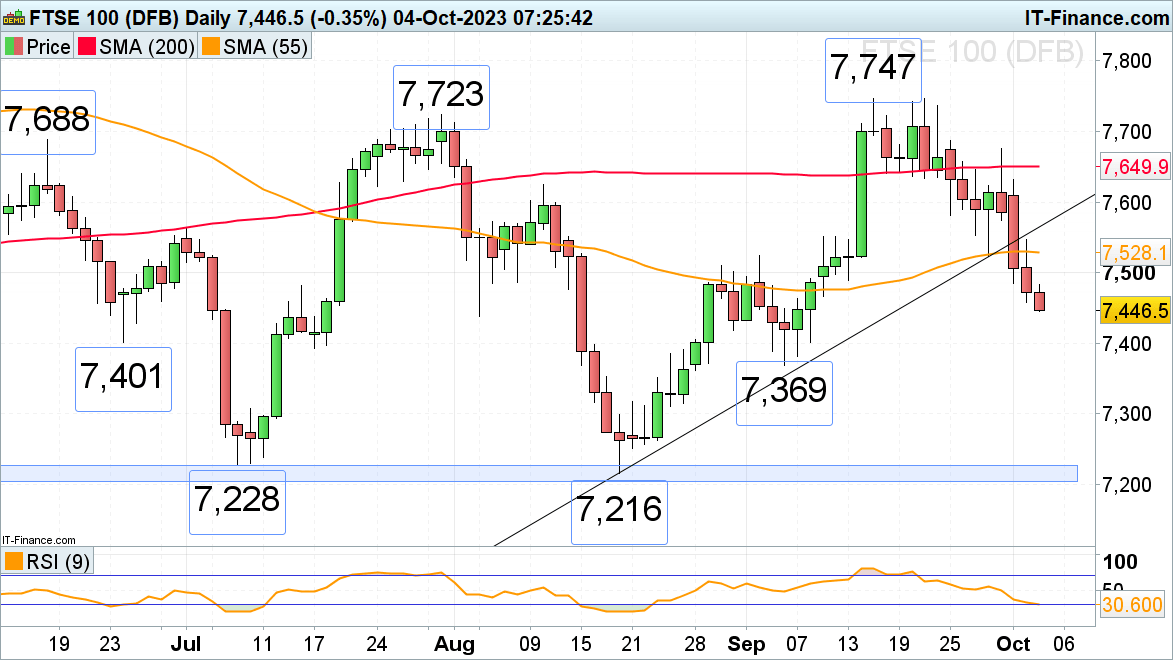
FTSE 100 slips to one-month low
The FTSE 100’s fall through the August-to-October uptrend line and the 55-day simple moving average (SMA) at 7,528 after three straight days of declines has the late June low at 7,401 in its sights. Below it, the early September low at 7,369 may also offer support.
Minor resistance above the 55-day SMA can be spotted at Tuesday’s 7,546 high and at the breached two-month uptrend line, now because of inverse polarity a resistance line, at 7,565.
FTSE 100 Daily Chart
Learn from Other’s Mistakes
Recommended by IG
Top Trading Lessons
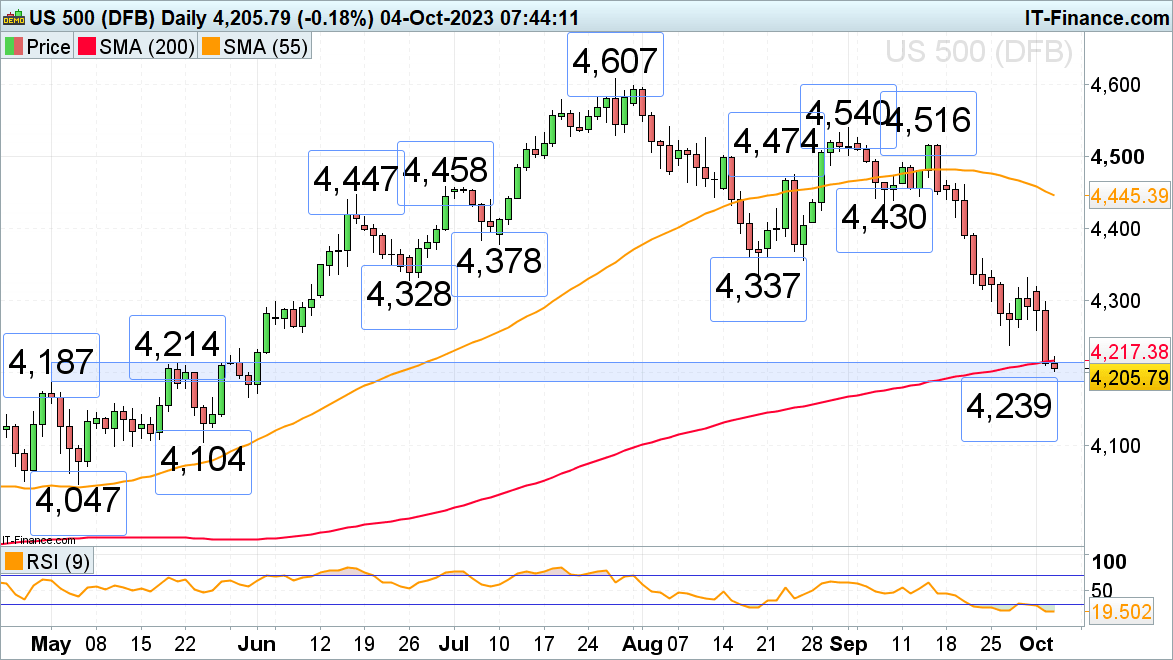
S&P 500 probes major support zone
The S&P 500 began the fourth quarter where it left off in the third, namely by declining further as the US 10-year Treasury yield rose above 4.85% and that of the 30-year bond hit the 5% mark, both at 2007 highs. Higher-than-expected job openings and the unprecedented removal of the Speaker of the House, which raises fears of paralysis in the US government, also pushed stocks lower.The 4,217 to 4,187 key support zone, which consists of the early and late May highs and the 200-day simple moving average (SMA), is currently being tested and may hold. If not, the next lower late May low at 4,166 may also be reached.
Initial resistance can be found at last week’s 4,238 low followed by Monday’s low at 4,260.
S&P 500 Daily Chart
Confidence in Trading is Key – Get our Free Guide
Recommended by IG
Building Confidence in Trading
[ad_2]
لینک منبع : هوشمند نیوز
 آموزش مجازی مدیریت عالی حرفه ای کسب و کار Post DBA آموزش مجازی مدیریت عالی حرفه ای کسب و کار Post DBA+ مدرک معتبر قابل ترجمه رسمی با مهر دادگستری و وزارت امور خارجه |  آموزش مجازی مدیریت عالی و حرفه ای کسب و کار DBA آموزش مجازی مدیریت عالی و حرفه ای کسب و کار DBA+ مدرک معتبر قابل ترجمه رسمی با مهر دادگستری و وزارت امور خارجه |  آموزش مجازی مدیریت کسب و کار MBA آموزش مجازی مدیریت کسب و کار MBA+ مدرک معتبر قابل ترجمه رسمی با مهر دادگستری و وزارت امور خارجه |
 مدیریت حرفه ای کافی شاپ |  حقوقدان خبره |  سرآشپز حرفه ای |
 آموزش مجازی تعمیرات موبایل آموزش مجازی تعمیرات موبایل |  آموزش مجازی ICDL مهارت های رایانه کار درجه یک و دو |  آموزش مجازی کارشناس معاملات املاک_ مشاور املاک آموزش مجازی کارشناس معاملات املاک_ مشاور املاک |
- نظرات ارسال شده توسط شما، پس از تایید توسط مدیران سایت منتشر خواهد شد.
- نظراتی که حاوی تهمت یا افترا باشد منتشر نخواهد شد.
- نظراتی که به غیر از زبان فارسی یا غیر مرتبط با خبر باشد منتشر نخواهد شد.


ارسال نظر شما
مجموع نظرات : 0 در انتظار بررسی : 0 انتشار یافته : 0