EUR/USD: Awaiting the Pair at 1.0200? ● Having started the past week on a positive note, EUR/USD approached a significant support/resistance level at the 1.0700 zone on Tuesday, October 24, before reversing and sharply declining. According to several analysts, the correction of the DXY Dollar Index that began on October 3rd, which correspondingly drove EUR/USD
A popular trading expression is “the trend is your friend.” This expression has stood the test of time because trends are critically important to any trading plan. Forex trendlines can be seen in almost any charting analysis due to its usefulness and simplicity. This article provides traders with an in-depth guide on what trendlines are, how to draw

The Multistrategy Balance Analyzer has been meticulously designed to empower algorithmic traders. It provides a platform to visualize and test trading strategies, allowing them to closely monitor, during the optimization process, the performance of individual strategies—be it by magic numbers or symbols. This is instrumental in gaining insights into the precise dynamics of each strategy
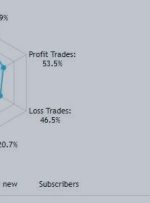
Osmosis is an advanced data driven automated trading robot which uses dynamic price differential algorithm and market volume to trade retracement on Gold (XAUUSD) . The price differential algorithm identifies various possible prices of execution, simultaneously pends and modifies orders until it gets the best possible price of execution. This makes the EA to use a

Towards the end of the week, the American currency managed to resume medium-term growth. Reversal combinations among commodity currencies were broken, and the pound, yen and euro went to test new lows. The sharp strengthening of the US dollar is most likely caused by the worsening geopolitical situation in the Middle East, rising oil prices
Seasonal patterns in the financial world are akin to well-guarded secrets that successful investors leverage to their advantage. These patterns are recurring price movements that occur during specific timeframes or around particular events. In this article, we delve into some of these patterns and tips for their optimal use. Additionally, we will explore how the
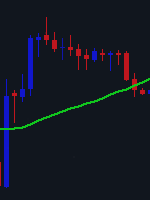
Most forex traders, irrespective of their trading skill levels, prefer using SMA because of its simplicity and ease of understanding. Using the indicator tool involves dividing the accumulated total of data points over a set period with the number of periods basing everything on the current currency prices. Furthermore, the indicator tool creates signals that


