
Poor Chinese Trade Data Sends Oil Lower
[ad_1] Brent Crude, WTI Oil Analysis Chinese export and import data worsens further, hitting oil markets as global outlook remains vulnerable Brent crude oil heads lower after souring Chinese trade data Brent bulls fail to test big level of resistance at $87 – downside scenarios analysed The analysis in this article makes use of chart

[ad_1]
Brent Crude, WTI Oil Analysis
- Chinese export and import data worsens further, hitting oil markets as global outlook remains vulnerable
- Brent crude oil heads lower after souring Chinese trade data
- Brent bulls fail to test big level of resistance at $87 – downside scenarios analysed
- The analysis in this article makes use of chart patterns and key support and resistance levels. For more information visit our comprehensive education library
Recommended by Richard Snow
How to Trade Oil
Chinese Exports and Import Data Worsens Further
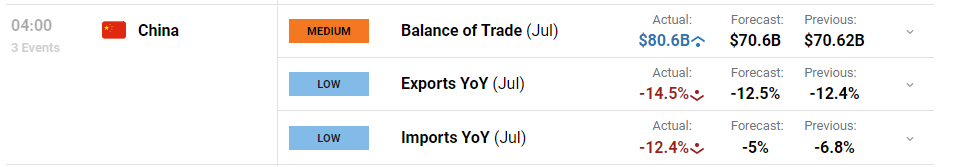
Chinese data took another step backwards in the early hours of this morning as import and export data witnessed worse-than-expected declines in July. Exports dropped 14.5%, worse than the 12.5% contraction anticipated while imports plummeted 12.4% from an expected 5% drop.
Customize and filter live economic data via our DailyFX economic calendar
The data accompanies lower trending manufacturing data which is seen contracting, no matter which version you refer to, the NBS or Caixin measure. The data confirms the harsh reality of the challenges faced by the Chinese reopening at a time when global growth is under threat – apart from the US it would seem.
The chart below shows import data on a downtrend even before the lockdown restrictions were removed, while export data appeared to top out at the end of last year when restrictions were lifted.
Chinese Trade Data Weakens Further
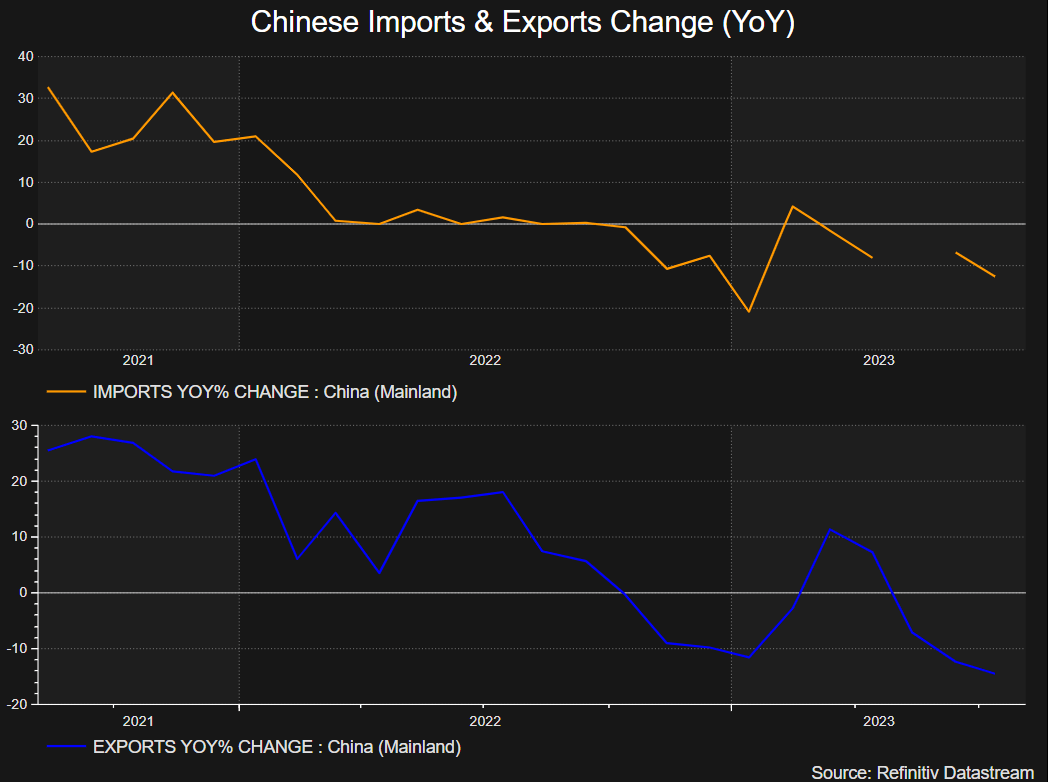
Source: Refinitiv, prepared by Richard Snow
Brent Crude Oil Heads Lower After Souring Chinese Trade Data
At the time of the data release (04:00 UK time) when the price of oil was around $85.50, oil started moving lower – something that continued into early European trade.
Brent Crude Oil 5-Minute Chart
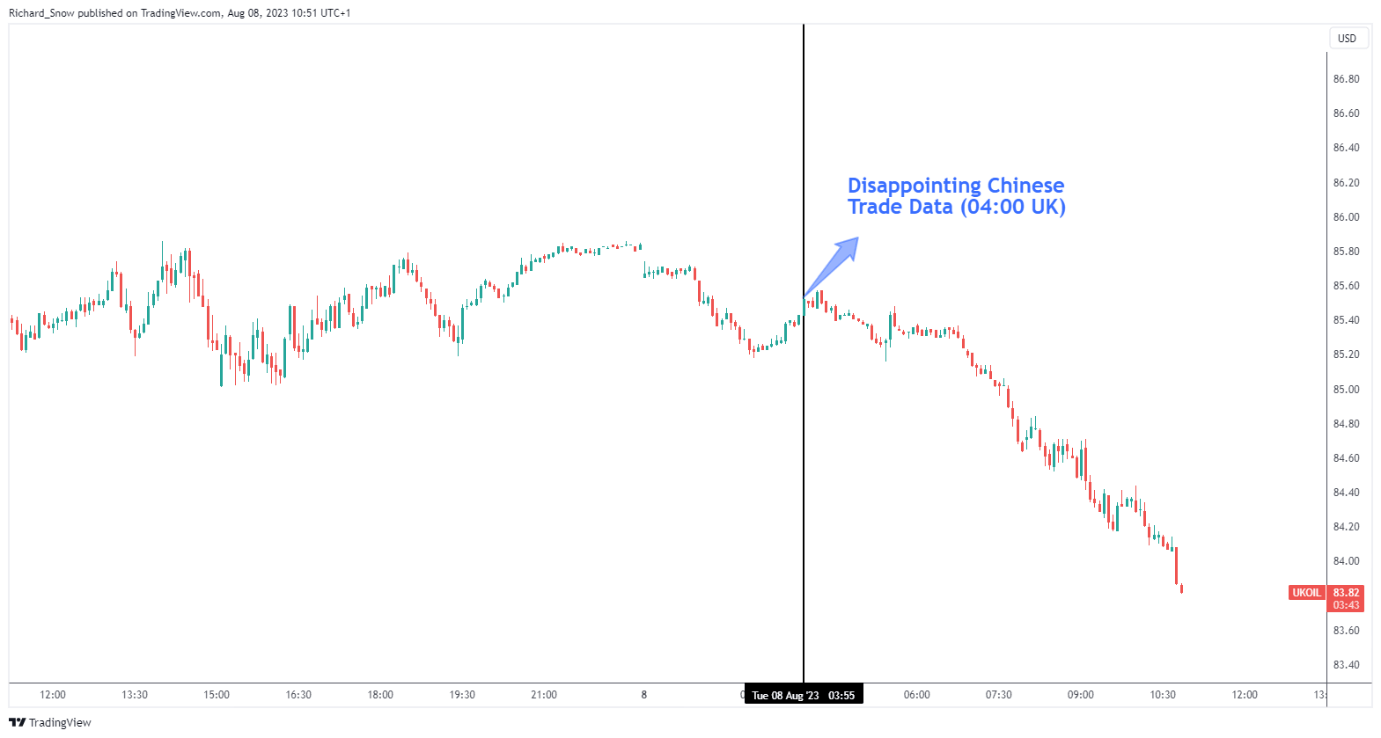
Source: TradingView, prepared by Richard Snow
Recommended by Richard Snow
Understanding the Core Fundamentals of Oil Trading
Brent Crude Oil Fails to Test Significant Level of Resistance
The daily chart reveals oil prices continuing from yesterday’s slight move lower, now accelerating the selloff in the commodity. Oil approached the very significant $87 marker and had seen signs of waning bullish momentum in the lead up to todays move lower.
Two daily candles attempting to trade back at $87 fell short of the mark, with intra-day pullbacks providing telling upper wicks. Today’s selloff continues with vigor, setting up what could land up being an ‘evening star-like’ candle stick pattern. While the candles do not match the exact characteristics of the pattern, price action appears to be sending a signal that bulls failed to reach a significant level of resistance allowing bears to see value to the downside on the back of the pessimistic Chinese data.
The MACD indicator is on the verge of a bearish crossover while the RSI heads lower after previously entering overbought territory. Levels to the downside appear at $82, followed by $78.60. Resistance remains at the $87 level.
Daily Brent Crude Oil Chart
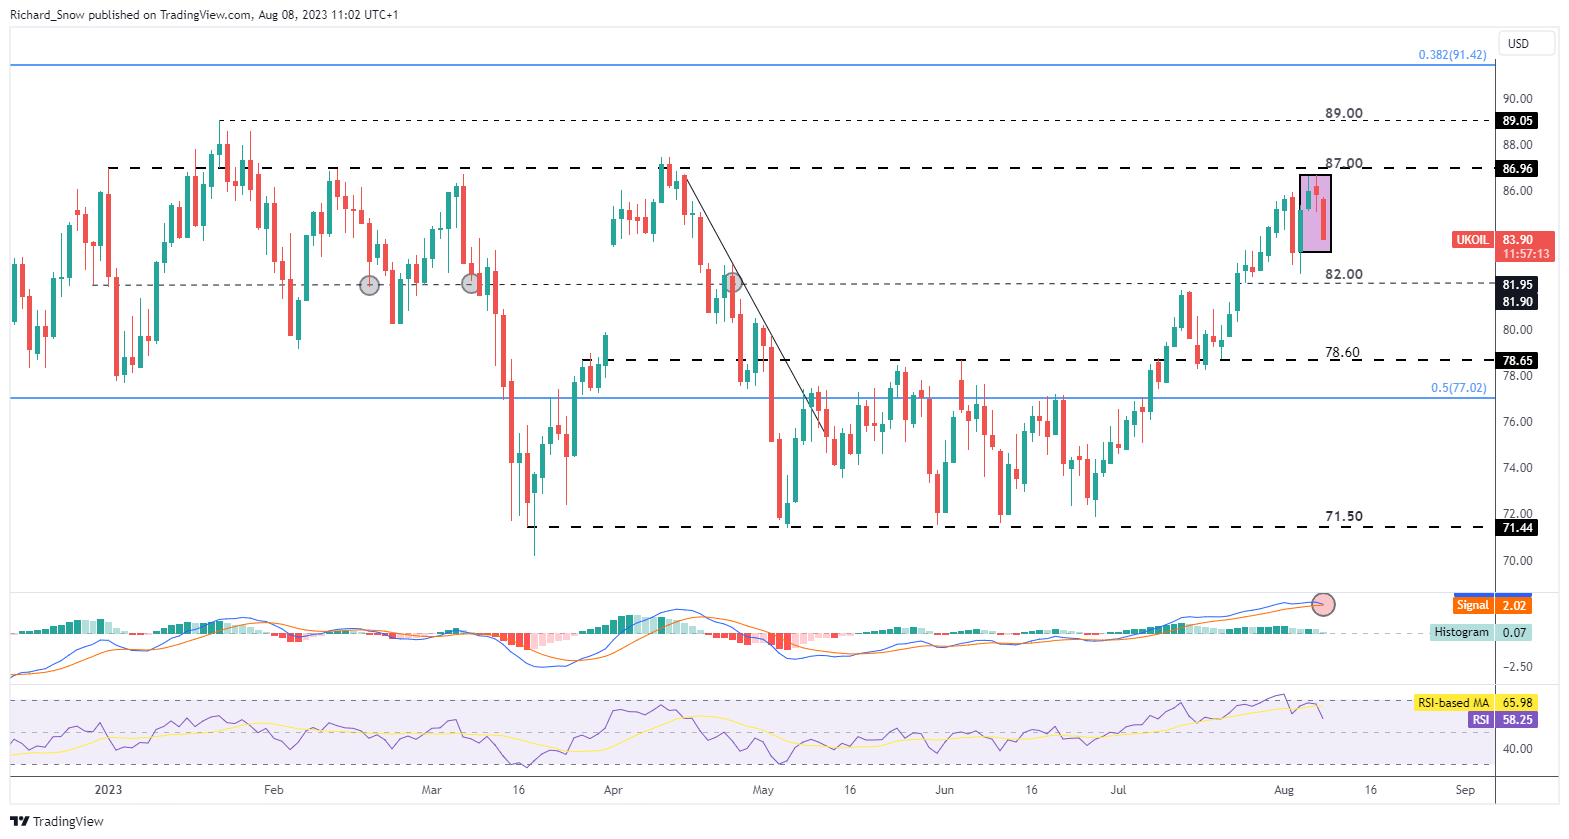
Source: TradingView, prepared by Richard Snow
The WTI chart follows Brent lower, breaking trendline support which has characterised the bullish advance which broke out since early July. Saudi Arabia announced that it would be removing a further 1 million barrels per day (bpd) alongside ongoing OPEC supply cuts, hoping to see oil prices head higher.
The bullish advance had taken shape since the Saudi cuts came into effect, which was also supported by a softer dollar in the early stages of July but prices continued to strengthen even as the dollar witnessed strong performance in the lead up to the FOMC announcement. Downside levels of interest appear at $78.70, followed by the long-term level of $77.40. Resistance appears at the prior trendline support, now resistance, followed by $82.50.
WTI Oil Daily Chart
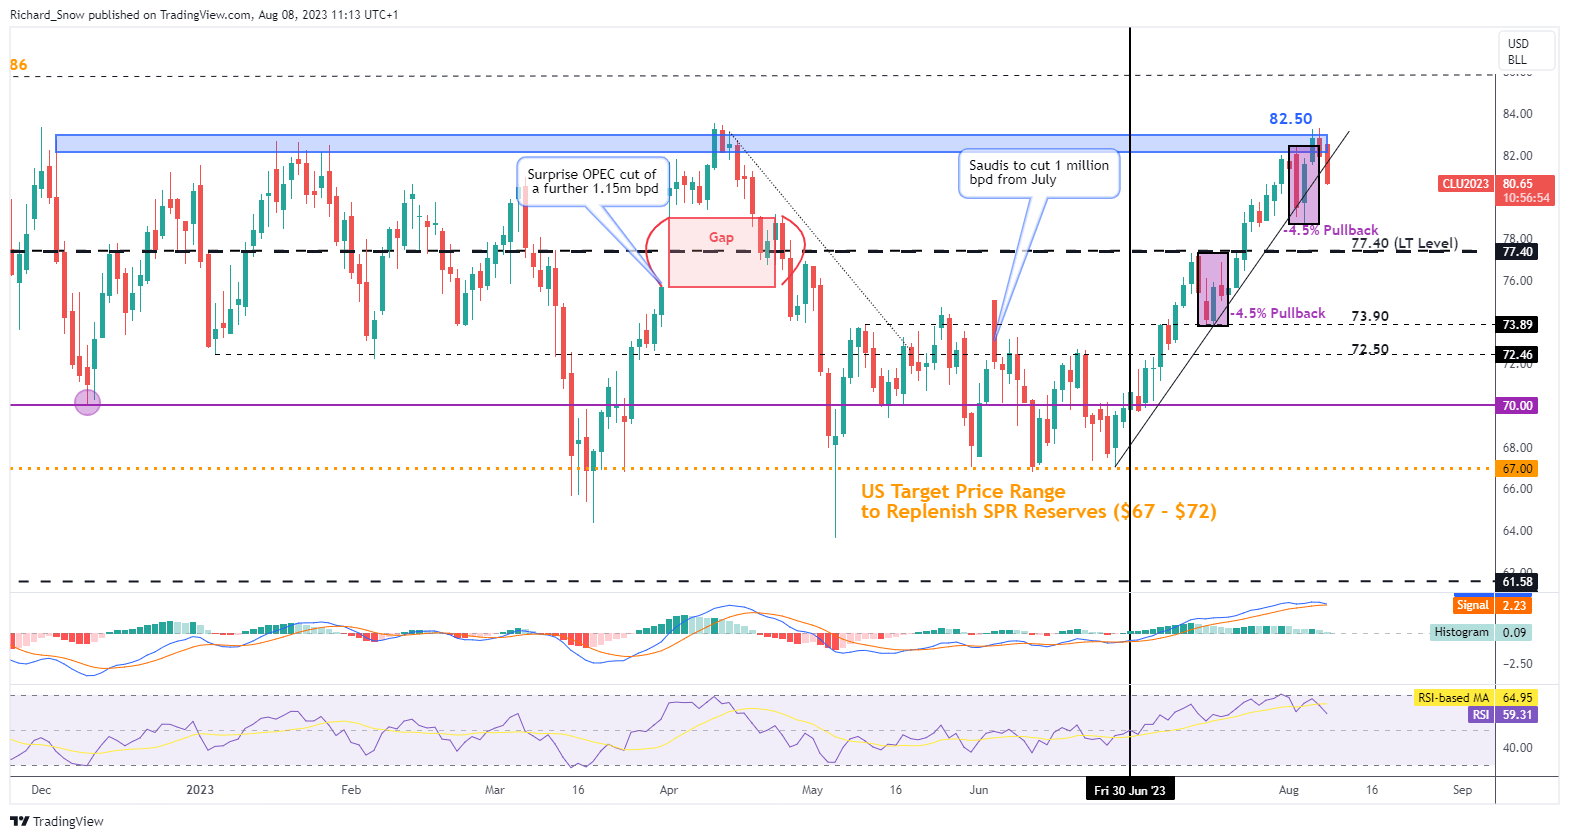
Source: TradingView, prepared by Richard Snow
Trade Smarter – Sign up for the DailyFX Newsletter
Receive timely and compelling market commentary from the DailyFX team
Subscribe to Newsletter
— Written by Richard Snow for DailyFX.com
Contact and follow Richard on Twitter: @RichardSnowFX
[ad_2]
لینک منبع : هوشمند نیوز
 آموزش مجازی مدیریت عالی حرفه ای کسب و کار Post DBA آموزش مجازی مدیریت عالی حرفه ای کسب و کار Post DBA+ مدرک معتبر قابل ترجمه رسمی با مهر دادگستری و وزارت امور خارجه |  آموزش مجازی مدیریت عالی و حرفه ای کسب و کار DBA آموزش مجازی مدیریت عالی و حرفه ای کسب و کار DBA+ مدرک معتبر قابل ترجمه رسمی با مهر دادگستری و وزارت امور خارجه |  آموزش مجازی مدیریت کسب و کار MBA آموزش مجازی مدیریت کسب و کار MBA+ مدرک معتبر قابل ترجمه رسمی با مهر دادگستری و وزارت امور خارجه |
 مدیریت حرفه ای کافی شاپ |  حقوقدان خبره |  سرآشپز حرفه ای |
 آموزش مجازی تعمیرات موبایل آموزش مجازی تعمیرات موبایل |  آموزش مجازی ICDL مهارت های رایانه کار درجه یک و دو |  آموزش مجازی کارشناس معاملات املاک_ مشاور املاک آموزش مجازی کارشناس معاملات املاک_ مشاور املاک |
- نظرات ارسال شده توسط شما، پس از تایید توسط مدیران سایت منتشر خواهد شد.
- نظراتی که حاوی تهمت یا افترا باشد منتشر نخواهد شد.
- نظراتی که به غیر از زبان فارسی یا غیر مرتبط با خبر باشد منتشر نخواهد شد.


ارسال نظر شما
مجموع نظرات : 0 در انتظار بررسی : 0 انتشار یافته : 0