

Oil Analysis and Charts
- Oil prices continue to slide on demand worries.
- The technical outlook remains biased to the downside.
Recommended by Nick Cawley
How to Trade Oil
DailyFX Economic Calendar
US oil is down nearly 16% in the last month and over 23% in the last seven weeks as sellers continue to control price action. After touching a $95/bbl. high on September 28th, US crude hit a multi-month low of $72.22/bbl. on Thursday with today’s marginal move higher seen as short closing ahead of the weekend. A decisive break below the 200-day simple moving average, made on Wednesday, now leaves oil vulnerable to further losses.
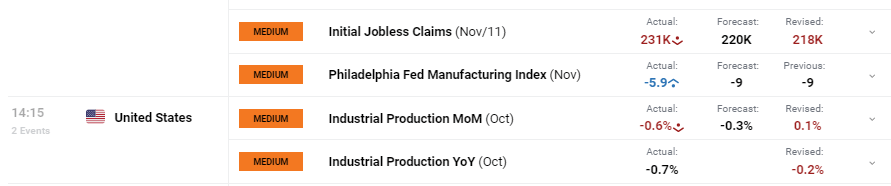
Recent data has weighed on oil and added to the bearish market tone. US continuing jobless claims and initial jobless claims came in higher than forecast on Thursday, while industrial production also fell by more than expected.
![]()
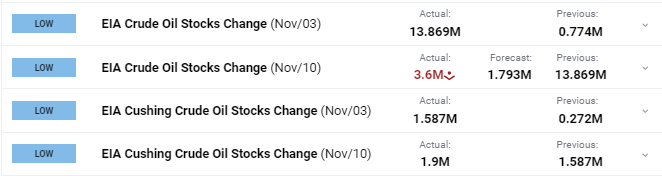
On the supply side of the equation, Wednesday’s EIA crude oil data showed an unexpectedly large build in inventories over the last two weeks.
Recommended by Nick Cawley
Get Your Free Oil Forecast
While the technical outlook for oil remains negative, the speed of the recent sell-off leaves it open to a partial retrace on any positive demand or supply news. The 200-dsma, currently at $78.12/bbl. will prove a tough level to breach in the short-term but may be tested if more benign market conditions prevail. If this short-term uptick does not materialize, and the 200-dsma remains untroubled, a break of Thursday’s $72.22/bbl. low would see $70/bbl. come into play before a triple bottom around $67/bbl. comes into focus.
Oil Daily Price Chart – November 17, 2023
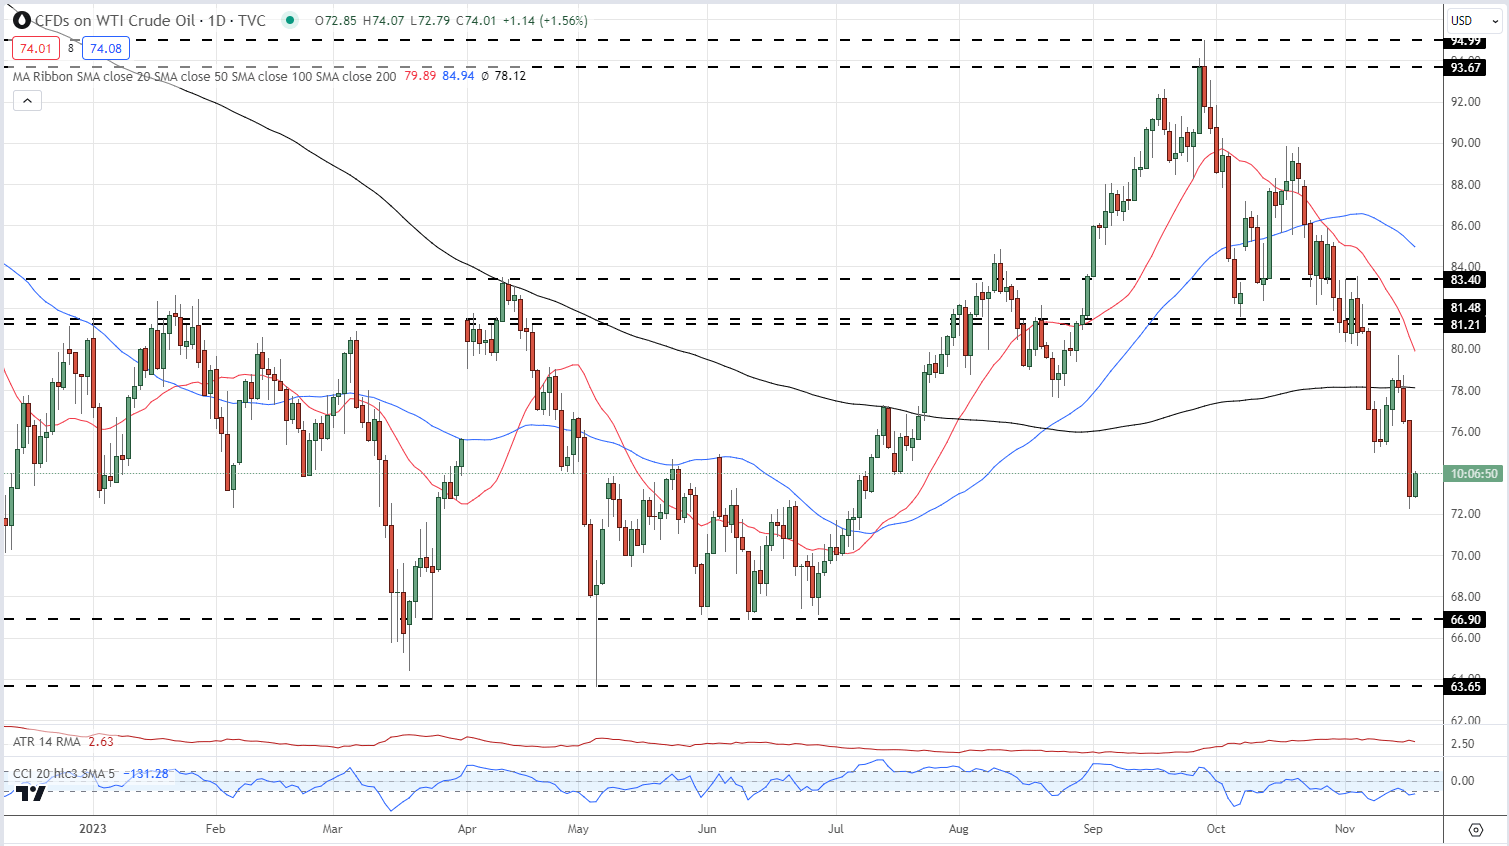
Chart via TradingView
IG Retail Trader data shows 89.11% of traders are net-long with the ratio of traders long to short at 8.18 to 1. The number of traders net-long is 16.50% higher than yesterday and 0.03% higher from last week, while the number of traders net-short is 30.08% lower than yesterday and 14.34% lower from last week.
Download the latest Sentiment Report to see how these daily and weekly changes affect price sentiment
| Change in | Longs | Shorts | OI |
| Daily | 14% | -31% | 6% |
| Weekly | -2% | -15% | -4% |
What is your view on Oil – bullish or bearish?? You can let us know via the form at the end of this piece or you can contact the author via Twitter @nickcawley1.

 آموزش مجازی مدیریت عالی و حرفه ای کسب و کار DBA


ارسال نظر شما
مجموع نظرات : 0 در انتظار بررسی : 0 انتشار یافته : 0