


Article by IG Chief Market Analyst Chris Beauchamp
Nasdaq 100, Dow Jones, Nikkei 225 Analysis and Charts
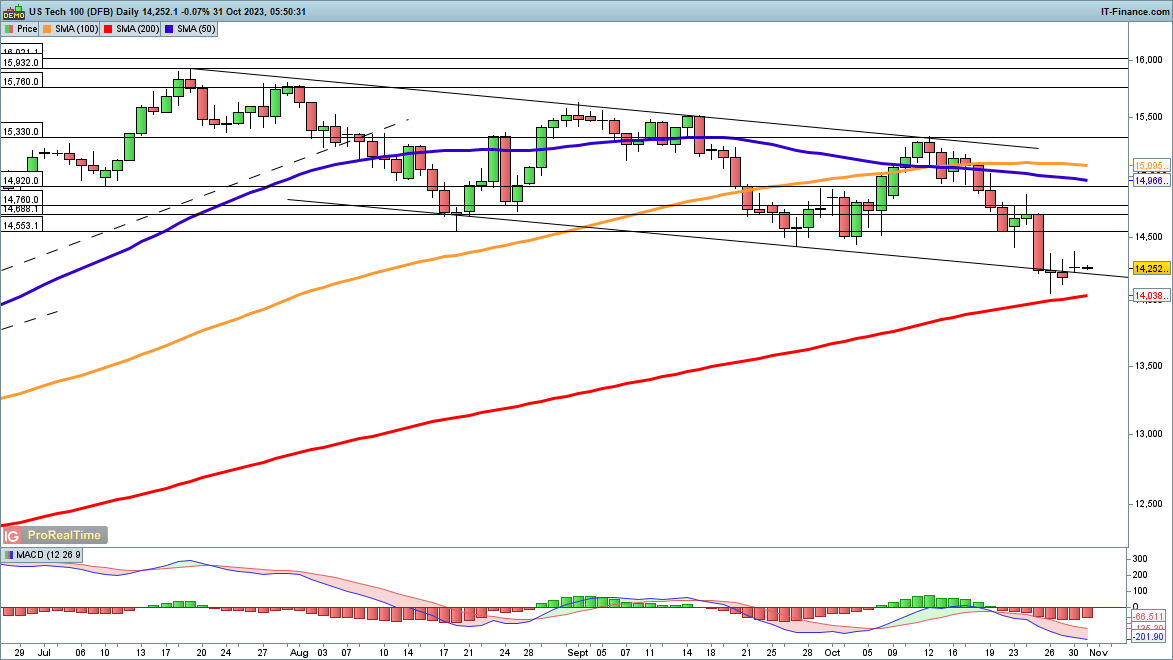
Nasdaq 100 continues its recovery
The index has recovered from the lows seen last week, after nearing the 200-day SMA. For the moment, the pullback from the October highs is still in place and leaves the bearish view intact for the short-term. A close above 14,400 (Monday’s highs) would suggest that the buyers remain in control, and a bullish daily MACD crossover would bolster that view.
This would then see the price target 14,800 initially. A reversal below 14,150 would indicate that the sellers are back in charge.
Nasdaq 100 Daily Chart
Recommended by IG
Get Your Free Equities Forecast
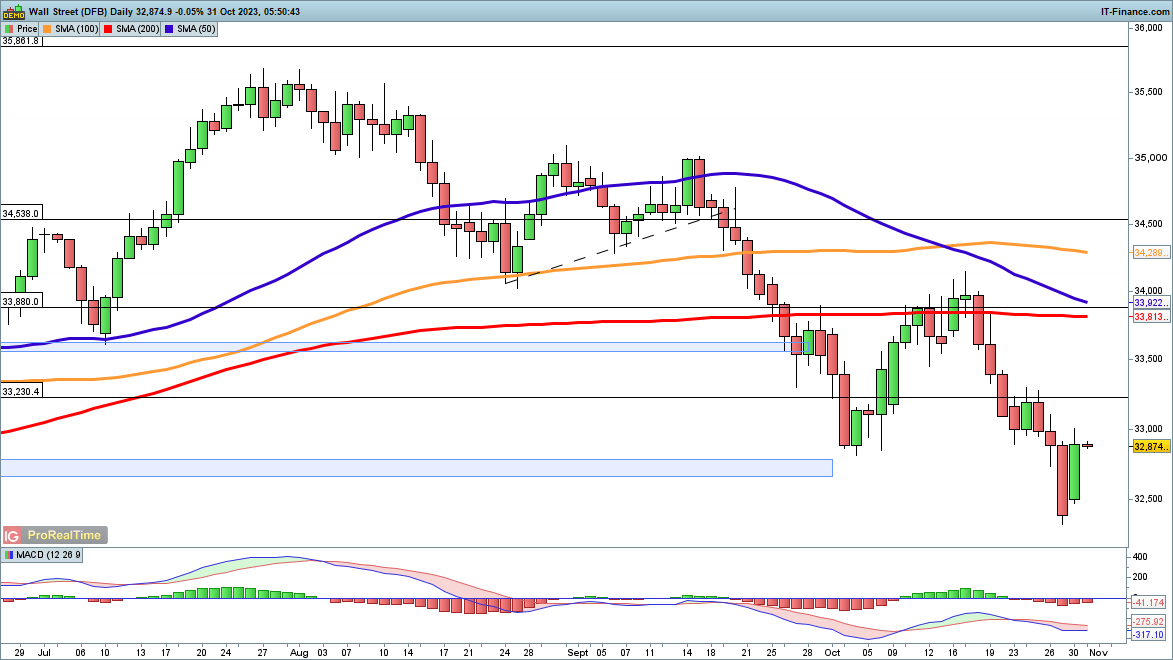
Dow edges above 33,000
Monday saw the index surge back towards 33,000, after a drop on Friday to fresh seven-month lows. Having moved back above the early October low, the index now looks in more short-term bullish form. The 200-day SMA and the 34,000 highs from early October now come into view.
A failure to hold above 32,700 would be a negative development for this bullish view, and a close back below 32,500 would add further weight to the bearish outlook.
Dow Jones Daily Chart
Recommended by IG
Get Your Free Top Trading Opportunities Forecast
Nikkei 225 rallies off support zone
Once more the price has begun to rally from the 30,500 area, in a similar move to that seen at the beginning of the month. In the short-term a rebound targets trendline resistance from the September high, and then the October highs around 32,500. Beyond this, gentler trendline resistance from the June highs comes into view.
Sellers have been unable to drive the price below 30,500 in any meaningful fashion, so while this holds the bearish view is limited.
Nikkei 225 Daily Chart


 آموزش مجازی مدیریت عالی و حرفه ای کسب و کار DBA









ارسال نظر شما
مجموع نظرات : 0 در انتظار بررسی : 0 انتشار یافته : 0