

Japanese Yen, USD/JPY, Fading Momentum – Technical Update:
- The Japanese Yen continues to weaken against the US Dollar
- Daily and 4-hour timeframes show signs of fading momentum
- Still, it will take much to overturn the USD/JPY bullish bias
Recommended by Daniel Dubrovsky
What is the outlook for the Japanese Yen?
The Japanese Yen continues to weaken against the US Dollar of late, but recent technical developments hint that perhaps the leg higher is showing signs of exhaustion. That said, even a mild pullback in USD/JPY will not be enough to overturn the current broader bullish technical bias. Still, let us take a closer look at the recent developments.
On the daily chart below, USD/JPY has left behind a Doji candlestick pattern. This is an early sign of indecision, especially within trending markets. Meanwhile, there is the presence of negative RSI divergence, a classic signal of fading upside momentum. This is as prices struggle to confirm a breakout above the June high of 145.07.
As such, there appears to be rising risk of a near-term reversal brewing. Still, a turn lower would place the focus on rising support from March which may reinstate the broader bullish bias. Otherwise, extending gains from here places the focus on the 61.8% Fibonacci extension level of 148.27.
| Change in | Longs | Shorts | OI |
| Daily | 4% | -3% | -1% |
| Weekly | -19% | 22% | 10% |
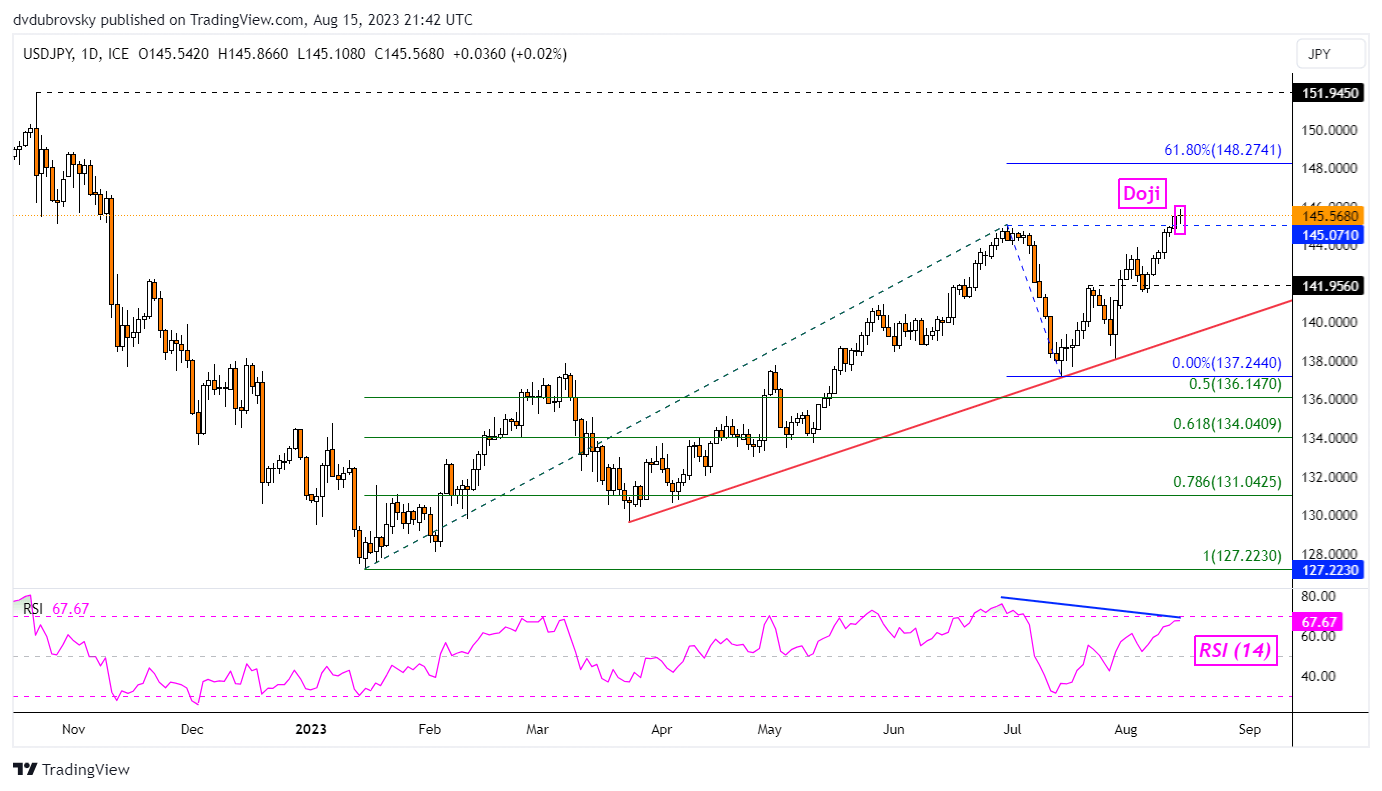
Chart Created in TradingView
Zooming in on the 4-hour timeframe reveals further interesting technical developments. A bearish Rising Wedge chart formation appears to be brewing. While USD/JPY remains within the boundaries of this shape, the immediate technical bias is bullish. But, a breakout lower (coupled with the signals on the daily chart) could open the door to a near-term bearish reversal.
In this timeframe, in such an outcome, keep a close eye on the 50- and 100-period Moving Averages. A bullish Golden Cross formed in late July, extending the broader bullish bias. These lines could hold as support in the event of a turn lower.
As such, while there appear to be rising signs of exhaustion, it would take meaningful downside momentum to overturn the broader bullish technical bias.
Recommended by Daniel Dubrovsky
What are the fundamentals of trading USD/JPY?
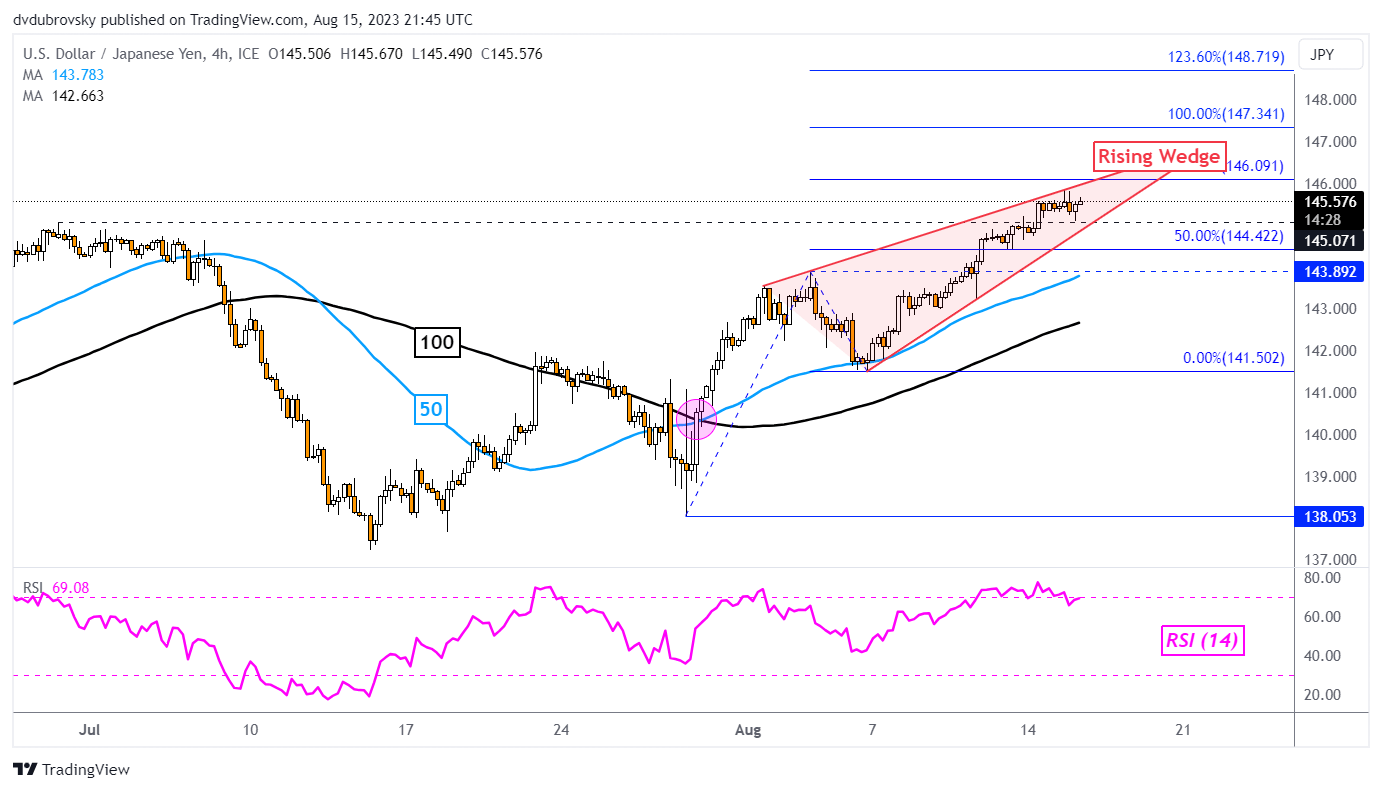
Chart Created in TradingView
— Written by Daniel Dubrovsky, Senior Strategist for DailyFX.com

 آموزش مجازی مدیریت عالی و حرفه ای کسب و کار DBA


ارسال نظر شما
مجموع نظرات : 0 در انتظار بررسی : 0 انتشار یافته : 0