
Gold Price Slips as US Dollar Recovers Ahead of US CPI. Lower XAU/USD?
[ad_1] Gold, XAU/USD, Treasury Yields, TIPS, Real Yields, BRIC, Gold Hoarding – Talking Points The gold price stabilised after the US Dollar found some support overnight Rising Treasury yields appear to be driving real yields ahead of US CPI A miss in CPI forecasts might have implications for real yields and XAU/USD Recommended by Daniel

[ad_1]
Gold, XAU/USD, Treasury Yields, TIPS, Real Yields, BRIC, Gold Hoarding – Talking Points
- The gold price stabilised after the US Dollar found some support overnight
- Rising Treasury yields appear to be driving real yields ahead of US CPI
- A miss in CPI forecasts might have implications for real yields and XAU/USD
Recommended by Daniel McCarthy
How to Trade Gold
The gold price dipped going into Wednesday’s trading session with the US Dollar consolidating after Monday’s rout and ahead of US CPI later today.
Undermining the precious metal is the continual climb of US real yields. When we step back and look at the bigger picture, the ascent of real yields might appear to be one-way traffic for now.
If today’s US CPI figure falls short of expectations, it might see long-term inflation expectations dip, adding to real yields.
If today’s US CPI figure beats estimates, it could add to worries of a tighter monetary policy from the Federal Reserve at next week’s Federal Open Market Committee (FOMC) meeting.
This could lead to the back end of the Treasury yield curve backing up, potentially underpinning real yields, particularly around the closely watched 10-year part of the curve.
A Bloomberg survey of economists is looking for headline CPI to print at 3.6% year-on-year to the end of August and 4.3% for the core reading.
Looking at the chart below, energy appears to be a notable contributing factor to CPI. Crude oil was little changed through August but it has rallied significantly in September.
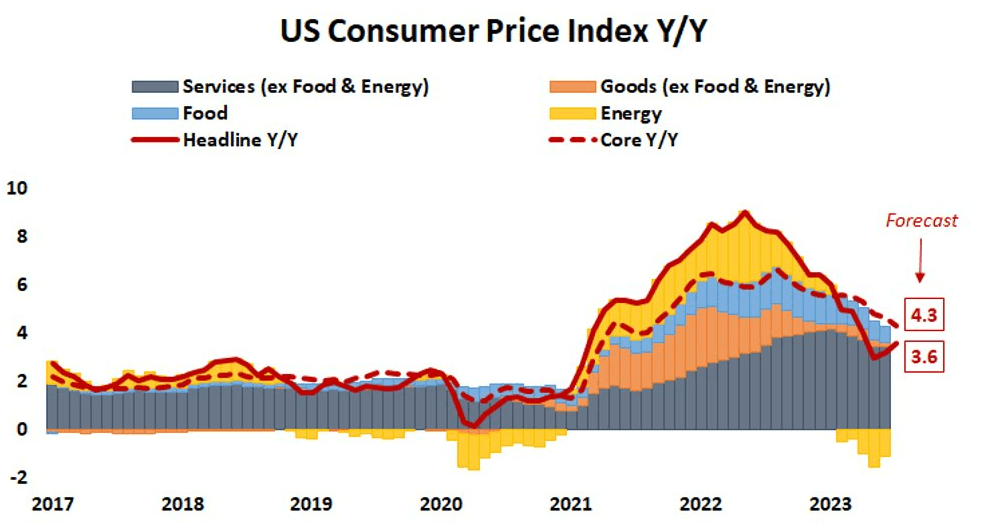
Source; Bloomberg and tastytrade
US real yields have been on the march higher for the better part of 2023 and recently stretched to a 14-year peak at the 10-year part of the curve, trading above 1.95%.
The real yield is the nominal yield less the market-priced inflation rate derived from Treasury inflation-protected securities (TIPS) for the same tenor.
It is looked at by markets as the true return of an investment as it allows for the time value of money that is impacted by price changes through inflation or deflation.
When we strip out the components of the real return, it is apparent that nominal yields have been driving real yields higher with the market-priced inflation expectations steady near 2.3%. That is slightly above the Fed’s CPI target of 2%.
The last time that real yields were this high was 2009 when spot gold was below US$ 1,000. More recently in 2018, when the real yield was near 1.0%, spot gold was under US$ 1,300 an ounce.
SPOT GOLD AGAINST US 10-YEAR REAL YIELD – THE BIGGER PICTURE
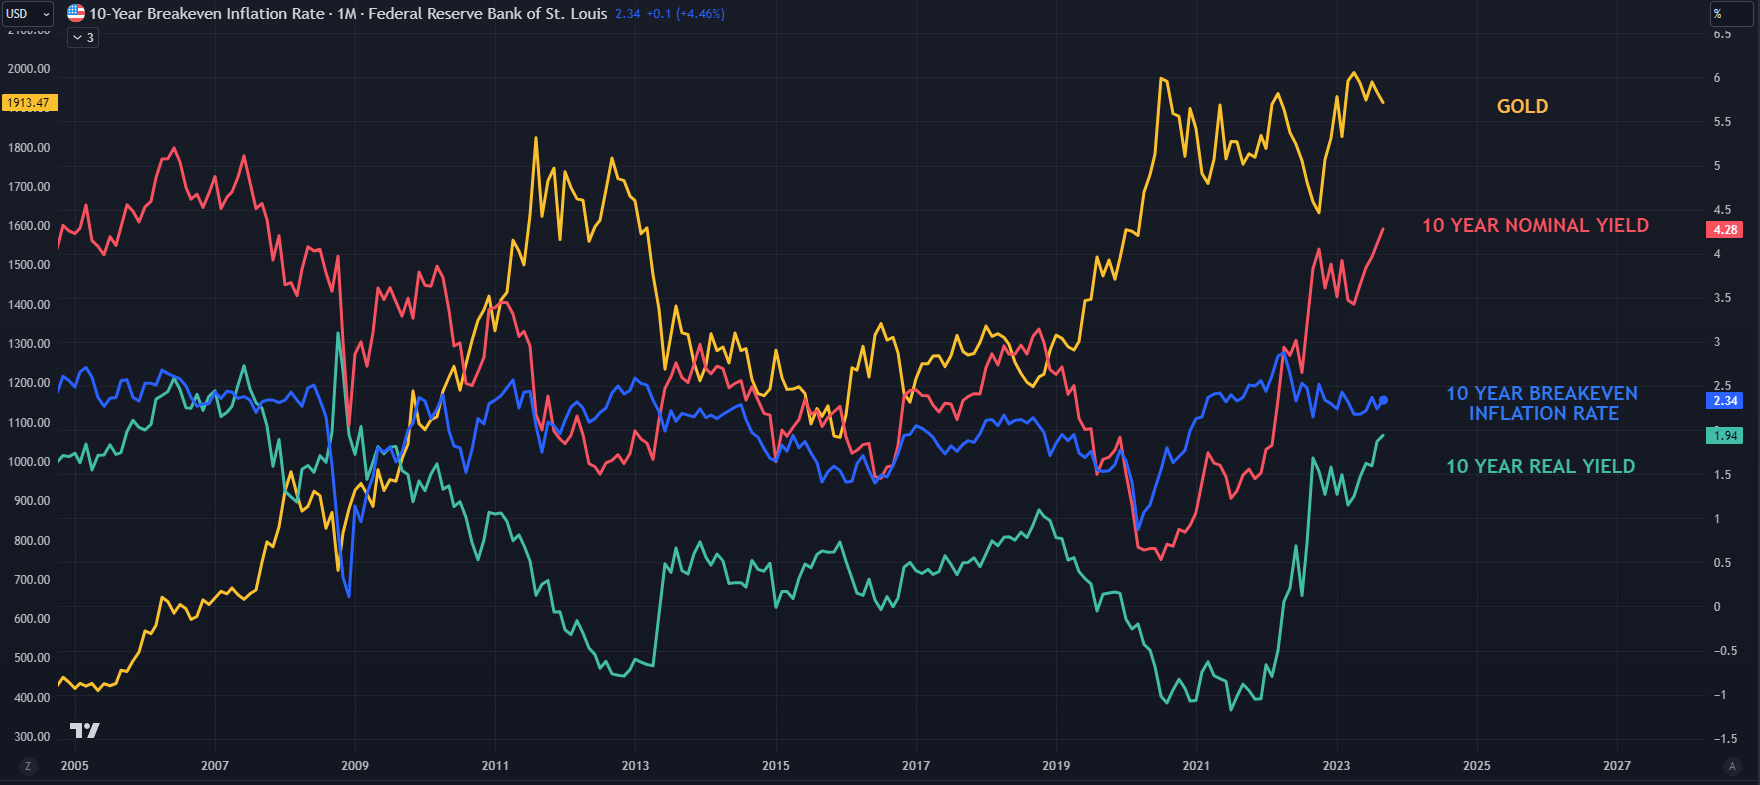
Chart created in TradingView
Of course, a global pandemic and a European theatre of war have opened up a different era and consequent change in the dynamic of demand for gold.
Looking ahead, a break of the recent range of US$ 1,885 – 1,900 could be the catalyst for the next notable move for XAU/USD. Click on the banner below to learn more about range trading.
Recommended by Daniel McCarthy
The Fundamentals of Range Trading
GOLD TECHNICAL ANALYSIS SNAPSHOT
The gold price appears to be ensconced in the range for now, having traded between 1885 and 1897 for six months.
Support could be in the 1885 – 1895 area where there are a series of prior lows, a breakpoint, and the 38.2% Fibonacci Retracement level of the move from 1614 up to 2062.
Further down the 50% Fibonacci Retracement at 1838 might lend support.
On the topside, resistance might be at the recent peaks of 1953 and 1897 or the spsychological level of 2000 where there is also the breakpoint nearby.
SPOT GOLD CHART
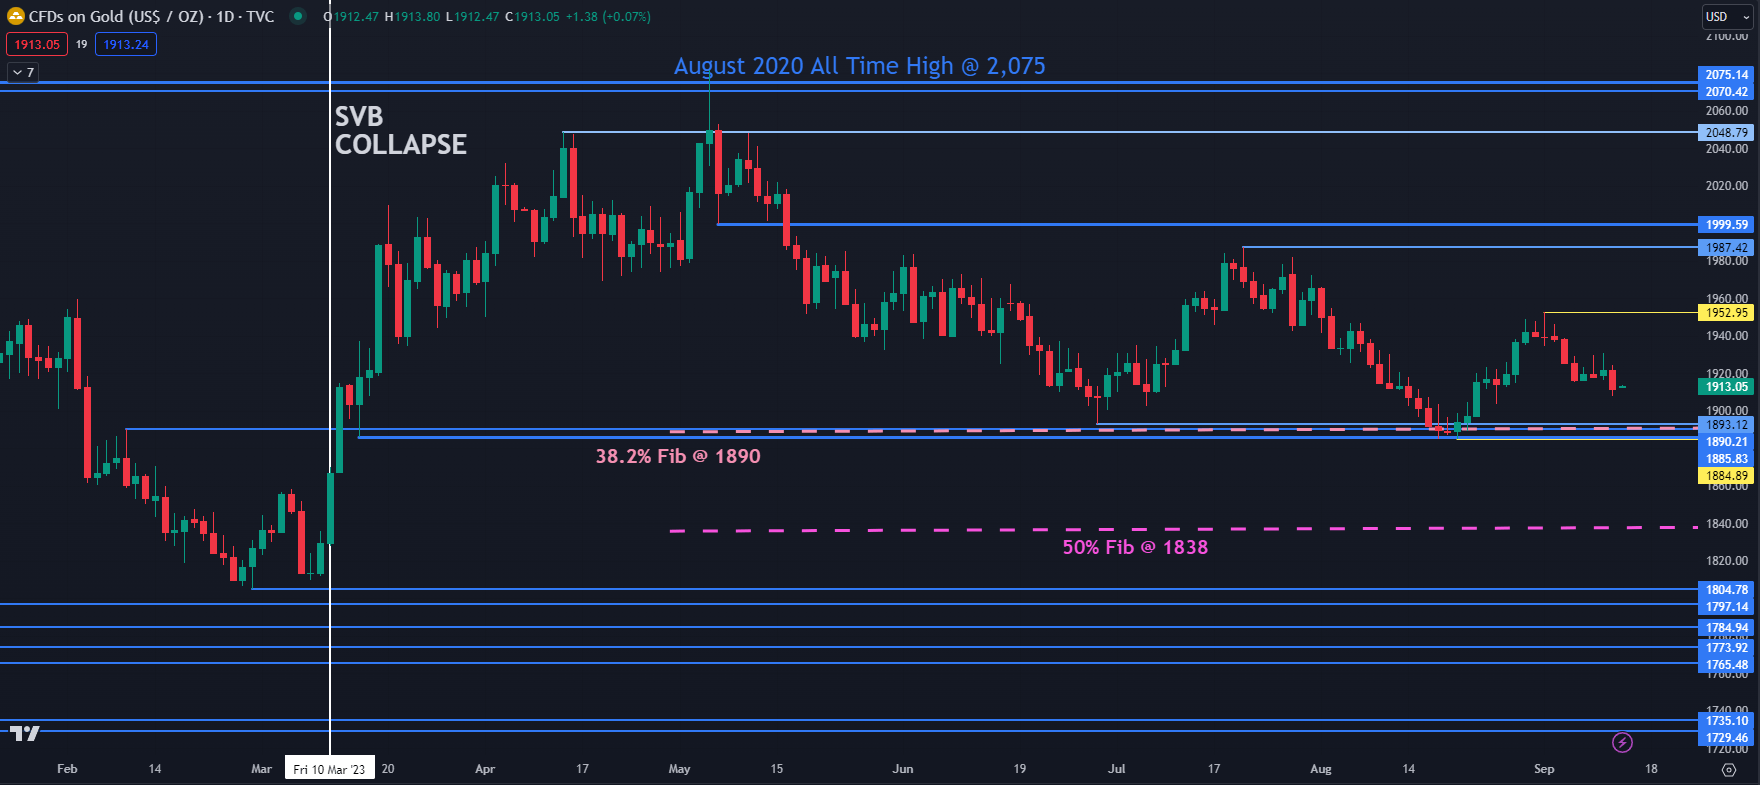
Chart created in TradingView
Trade Smarter – Sign up for the DailyFX Newsletter
Receive timely and compelling market commentary from the DailyFX team
Subscribe to Newsletter
— Written by Daniel McCarthy, Strategist for DailyFX.com
Please contact Daniel via @DanMcCathyFX on Twitter
[ad_2]
لینک منبع : هوشمند نیوز
 آموزش مجازی مدیریت عالی حرفه ای کسب و کار Post DBA آموزش مجازی مدیریت عالی حرفه ای کسب و کار Post DBA+ مدرک معتبر قابل ترجمه رسمی با مهر دادگستری و وزارت امور خارجه |  آموزش مجازی مدیریت عالی و حرفه ای کسب و کار DBA آموزش مجازی مدیریت عالی و حرفه ای کسب و کار DBA+ مدرک معتبر قابل ترجمه رسمی با مهر دادگستری و وزارت امور خارجه |  آموزش مجازی مدیریت کسب و کار MBA آموزش مجازی مدیریت کسب و کار MBA+ مدرک معتبر قابل ترجمه رسمی با مهر دادگستری و وزارت امور خارجه |
 مدیریت حرفه ای کافی شاپ |  حقوقدان خبره |  سرآشپز حرفه ای |
 آموزش مجازی تعمیرات موبایل آموزش مجازی تعمیرات موبایل |  آموزش مجازی ICDL مهارت های رایانه کار درجه یک و دو |  آموزش مجازی کارشناس معاملات املاک_ مشاور املاک آموزش مجازی کارشناس معاملات املاک_ مشاور املاک |
- نظرات ارسال شده توسط شما، پس از تایید توسط مدیران سایت منتشر خواهد شد.
- نظراتی که حاوی تهمت یا افترا باشد منتشر نخواهد شد.
- نظراتی که به غیر از زبان فارسی یا غیر مرتبط با خبر باشد منتشر نخواهد شد.


ارسال نظر شما
مجموع نظرات : 0 در انتظار بررسی : 0 انتشار یافته : 0