GBP/USD, AUD/USD, EUR/USD Price Action
US Dollar, DXY, Euro, British Pound, Australian Dollar – Outlook: Too soon to say if USD has topped. EUR/USD and GBP/USD appear to be in search of a bottom; AUD/USD drifts lower. What is the outlook and key levels to watch in EUR/USD, GBP/USD, and AUD/USD? Discover the power of crowd mentality. Download our free

US Dollar, DXY, Euro, British Pound, Australian Dollar – Outlook:
- Too soon to say if USD has topped.
- EUR/USD and GBP/USD appear to be in search of a bottom; AUD/USD drifts lower.
- What is the outlook and key levels to watch in EUR/USD, GBP/USD, and AUD/USD?
Discover the power of crowd mentality. Download our free sentiment guide to decipher how shifts in AUD/USD’s positioning can act as key indicators for upcoming price movements.
Recommended by Manish Jaradi
Improve your trading with IG Client Sentiment Data
The US dollar continues to trade strongly amid rising yields and escalating tensions in the Middle East, after US Federal Reserve Chair Jerome Powell stopped short of hinting that US interest rates have peaked.
Powell acknowledged the impact of tightening of financial conditions but stopped short of closing the possibility of further tightening given the strength of the economy and tight labor markets. However, Powell echoed the remarks of some of his colleagues saying the rise in yields “at the margin” might lessen the need for additional hikes. On balance, it appears that Powell’s tone was a touch dovish, though the central bank isn’t prepared to close the door yet on further tightening. The market is pricing in a high chance that the Fed will keep interest rates steady at its Oct. 31-Nov. 1 meeting.
The US dollar has been driven higher in recent months, thanks to the outperformance of the US economy relative to the rest of the world coupled with a relatively hawkish Fed compared with its peers. Even if the market leans toward the view that US rates have pivoted, unless there is economic convergence, the US dollar could stay well bid even if there is monetary policy convergence.
DXY Index Weekly Chart
Chart Created by Manish Jaradi Using TradingView
On technical charts, the index is testing major resistance on the upper edge of the Ichimoku cloud on the weekly charts, not too far from the March high of 105.90. While the greenback’s rally may have stalled for now, it is too soon to say it is over. For the immediate upward pressure to fade, the index at minimum would need to fall below initial support at last week’s low of 105.50.
EUR/USD Weekly Chart

Chart Created by Manish Jaradi Using TradingView
EUR/USD: Is this it?
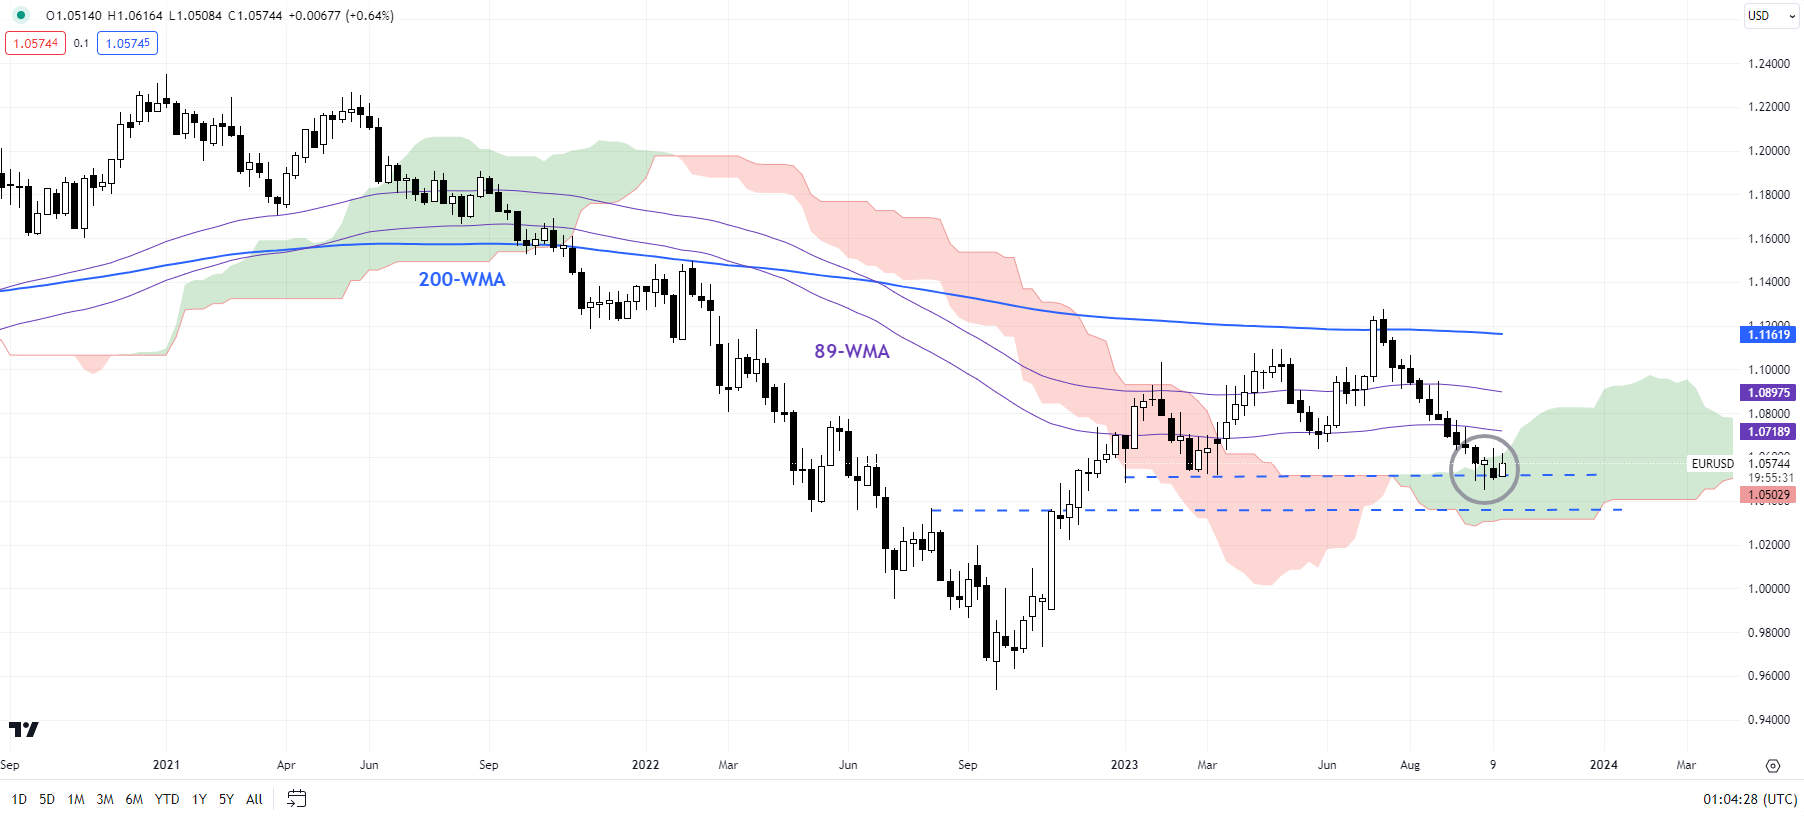
EUR/USD’s slide has paused at key support at the March low of 1.0500, near the lower edge of the Ichimoku cloud on the weekly charts. This support is strong and may not be easily broken, at least in the first attempt, especially given the sharp decline in recent weeks. So a minor rebound wouldn’t be surprising. Having said that, for a meaningful rebound to occur the pair needs to break above this month’s high of 1.0635. Until then, the balance of risks remains tilted sideways to down. For more discussion, including fundamentals, see “Is Euro’s Downtrend Over? EUR/USD, EUR/AUD, EUR/NZD Price Setups,” published October 12.
Looking for actionable trading ideas? Download our top trading opportunities guide packed with insightful tips for the fourth quarter!
Recommended by Manish Jaradi
Get Your Free Top Trading Opportunities Forecast
GBP/USD Weekly Chart

Chart Created by Manish Jaradi Using TradingView
GBP/USD: In search of a bottom
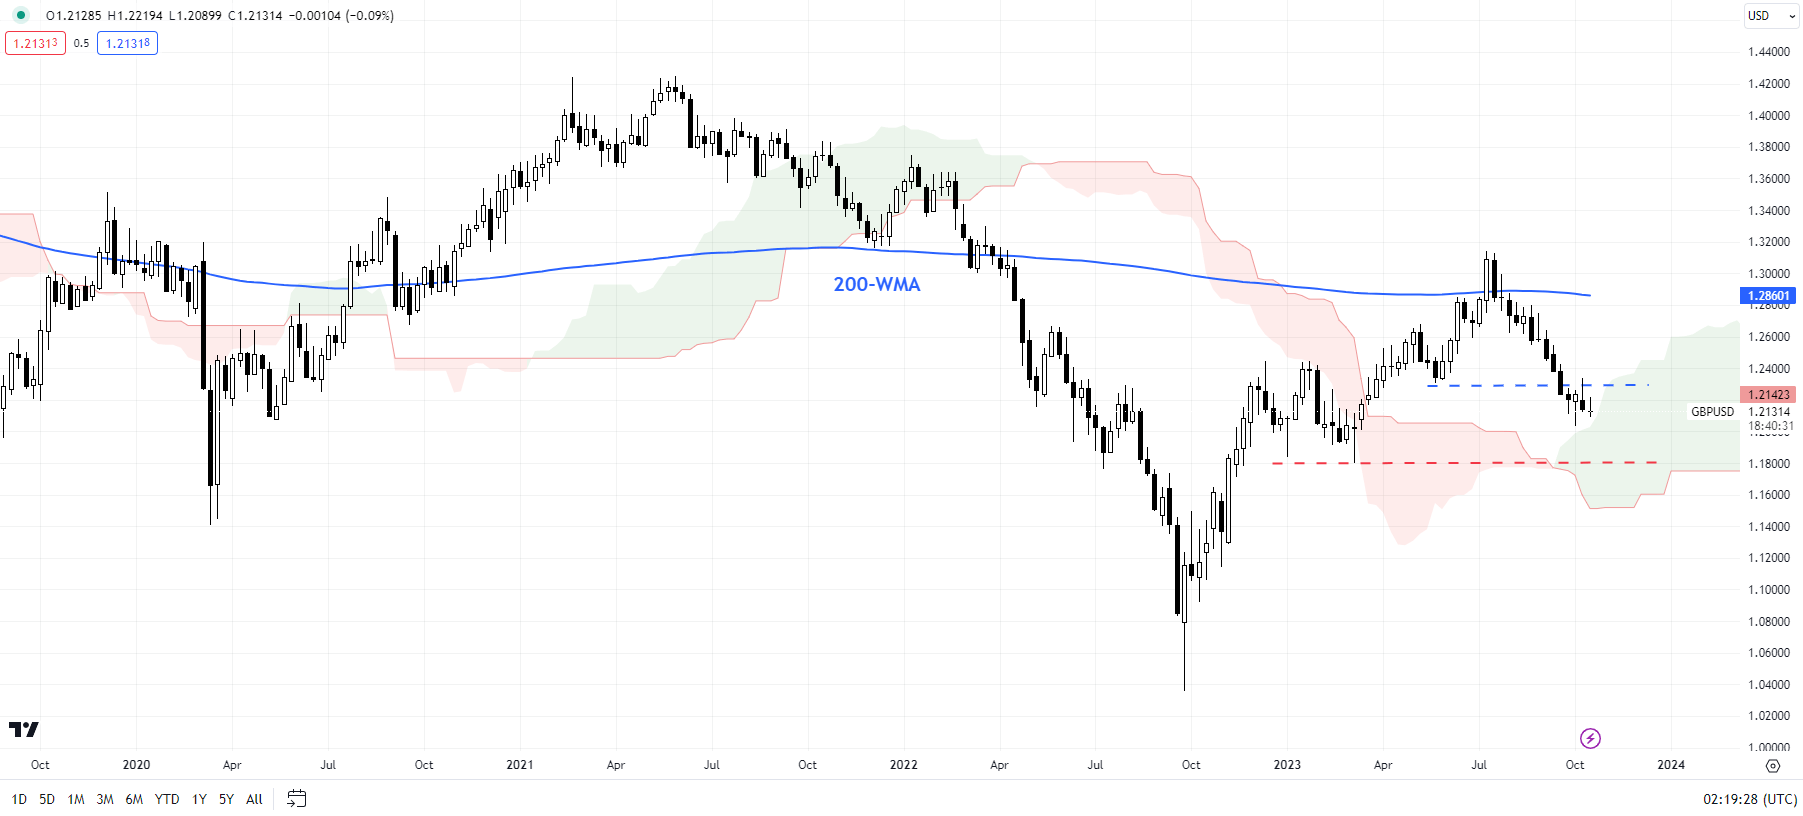
GBP/USDappears to be in search of a low with the slide pausing around key support at the May low of 1.2300. Granted, the pair looks oversold as speculative long GBP positioning has been unwound. Still, there’s no evidence of a price reversal ahead of strong converged support at the early 2023 lows of around 1.1800, not too far from the lower edge of the Ichimoku cloud on the weekly charts. For more discussion, including fundamentals, see “British Pound Ahead of US CPI: GBP/USD, EUR/GBP, GBP/AUD Price Setups,” published October 11.
AUD/USD Daily Chart

Chart Created by Manish Jaradi Using TradingView
AUD/USD: Gradually drifting lower
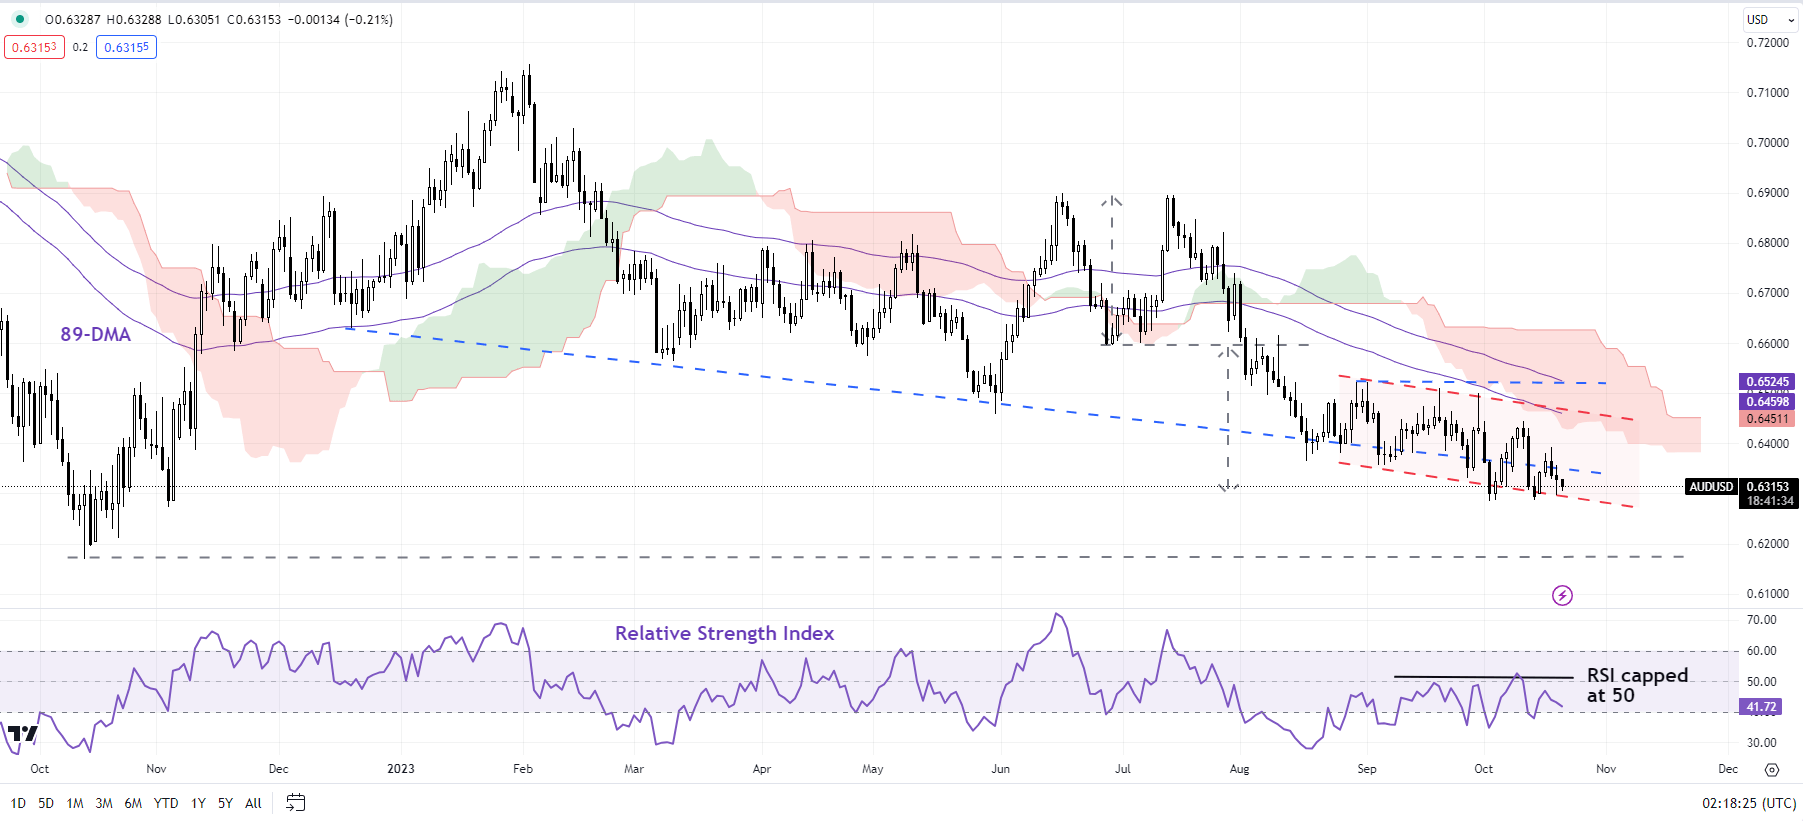
AUD/USDappears to be gradually losing grip as it struggles to hold above support on the lower edge of a declining channel since August, around minor support at the early-October low of 0.6285. The repeated lower-lows-lower-highs indicate downside risks prevail unless AUD/USD breaks above resistance at the end-August high of 0.6525. For more discussion, including fundamentals, see “Australian Dollar Jumps After China GDP Beat; What’s Next for AUD/USD?” published October 18.
Supercharge your trading prowess with an in-depth analysis of oil‘s outlook, offering insights from both fundamental and technical viewpoints. Claim your free Q4 trading guide now!
Recommended by Manish Jaradi
Get Your Free Oil Forecast
— Written by Manish Jaradi, Strategist for DailyFX.com
— Contact and follow Jaradi on Twitter: @JaradiManish
 آموزش مجازی مدیریت عالی حرفه ای کسب و کار Post DBA آموزش مجازی مدیریت عالی حرفه ای کسب و کار Post DBA+ مدرک معتبر قابل ترجمه رسمی با مهر دادگستری و وزارت امور خارجه |  آموزش مجازی مدیریت عالی و حرفه ای کسب و کار DBA آموزش مجازی مدیریت عالی و حرفه ای کسب و کار DBA+ مدرک معتبر قابل ترجمه رسمی با مهر دادگستری و وزارت امور خارجه |  آموزش مجازی مدیریت کسب و کار MBA آموزش مجازی مدیریت کسب و کار MBA+ مدرک معتبر قابل ترجمه رسمی با مهر دادگستری و وزارت امور خارجه |
 مدیریت حرفه ای کافی شاپ |  حقوقدان خبره |  سرآشپز حرفه ای |
 آموزش مجازی تعمیرات موبایل آموزش مجازی تعمیرات موبایل |  آموزش مجازی ICDL مهارت های رایانه کار درجه یک و دو |  آموزش مجازی کارشناس معاملات املاک_ مشاور املاک آموزش مجازی کارشناس معاملات املاک_ مشاور املاک |
- نظرات ارسال شده توسط شما، پس از تایید توسط مدیران سایت منتشر خواهد شد.
- نظراتی که حاوی تهمت یا افترا باشد منتشر نخواهد شد.
- نظراتی که به غیر از زبان فارسی یا غیر مرتبط با خبر باشد منتشر نخواهد شد.


ارسال نظر شما
مجموع نظرات : 0 در انتظار بررسی : 0 انتشار یافته : ۰