
FTSE 100, S&P 500 and Russell 2000 Consolidate Ahead of Thanksgiving
[ad_1] Article by IG Senior Market Analyst Axel Rudolph FTSE 100, S&P 500, Russell 2000 – Analysis and Charts FTSE 100 consolidates below last week’s high The FTSE 100’s recent attempts to reach last week’s high at 7,535 have so far failed with the index being capped by the 55-day simple moving average (SMA) at

[ad_1]
Article by IG Senior Market Analyst Axel Rudolph
FTSE 100, S&P 500, Russell 2000 – Analysis and Charts
FTSE 100 consolidates below last week’s high
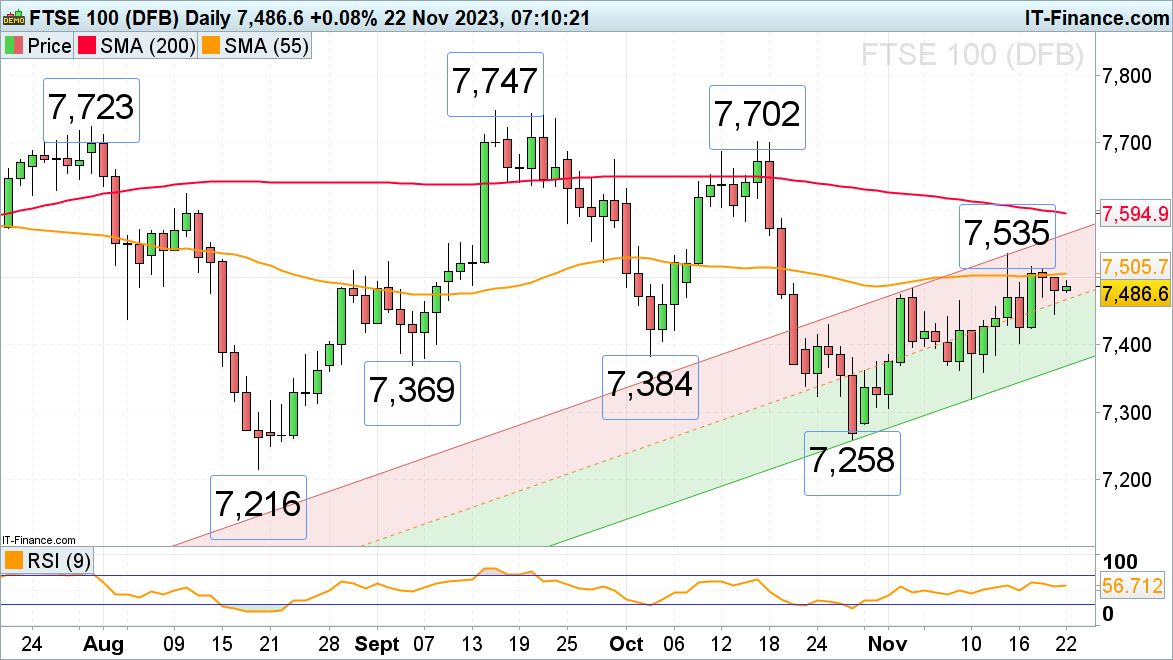
The FTSE 100’s recent attempts to reach last week’s high at 7,535 have so far failed with the index being capped by the 55-day simple moving average (SMA) at 7,505 as US futures and Asian stocks mostly decline after Nvidia earnings which practically mark the end of the US earnings season ahead of Thanksgiving.
While the UK blue chip index remains above Tuesday’s 7,446 low, it remains in an uptrend, though, and is more likely to revisit Friday’s 7,516 high than to revert lower. Further up beckons the current November peak at 7,535, a rise above which would target the 200-day simple moving average (SMA) at 7,595.
Minor support can be found around the 9 November high at 7,466 ahead of Tuesday’s 7,446 low. Further down lies Thursday’s 7,430 low, followed by the early September and early October lows at 7,384 to 7,369.
FTSE 100 Daily Chart
Download the Latest FTSE 100 Sentiment Data
| Change in | Longs | Shorts | OI |
| Daily | 11% | -12% | 4% |
| Weekly | 7% | 0% | 5% |
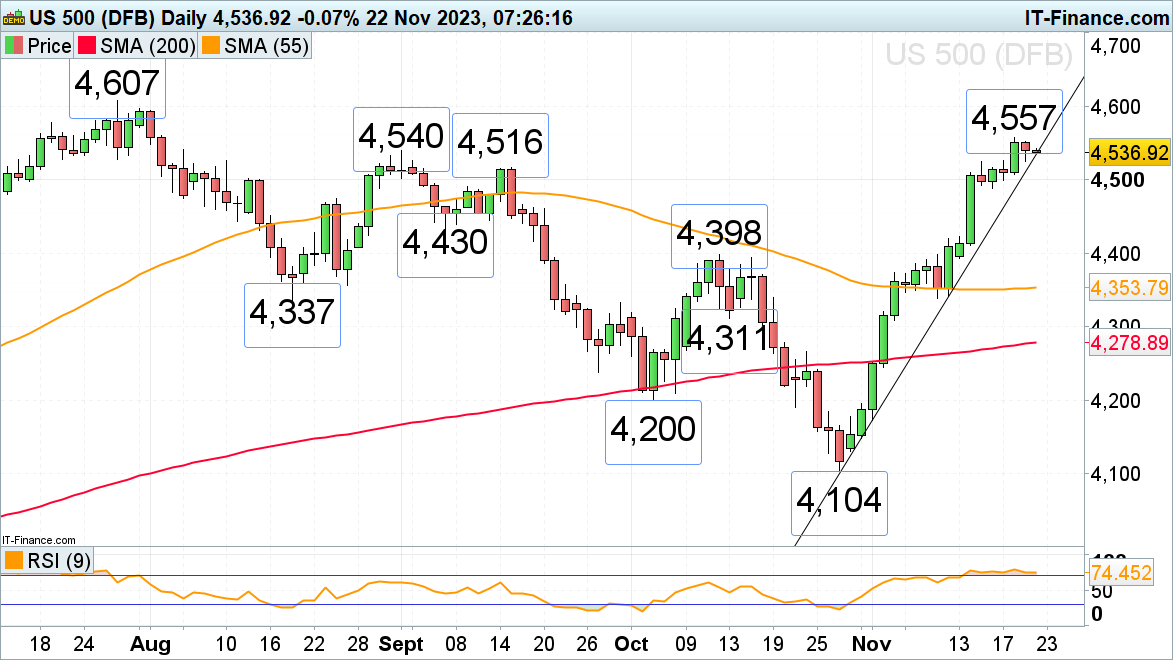
S&P 500 advance stalls around the September peak at 4,540
The sharp rally in the S&P 500 has reached the early and mid-September highs at 4,516 to 4,540 around which it is losing upside momentum after Fed minutes showed no inclination to cut rates by next May. A minor pullback ahead of the prolonged Thanksgiving weekend may thus ensue with the mid-November high at 4,524 being revisited. Further minor support sits at the 11 September high at 4,491 and still further down around the 24 August high at 4,474.
A rise above this week’s 4,557 high would put the 4,607 July high on the cards.
S&P 500 Daily Chart
Recommended by IG
Traits of Successful Traders
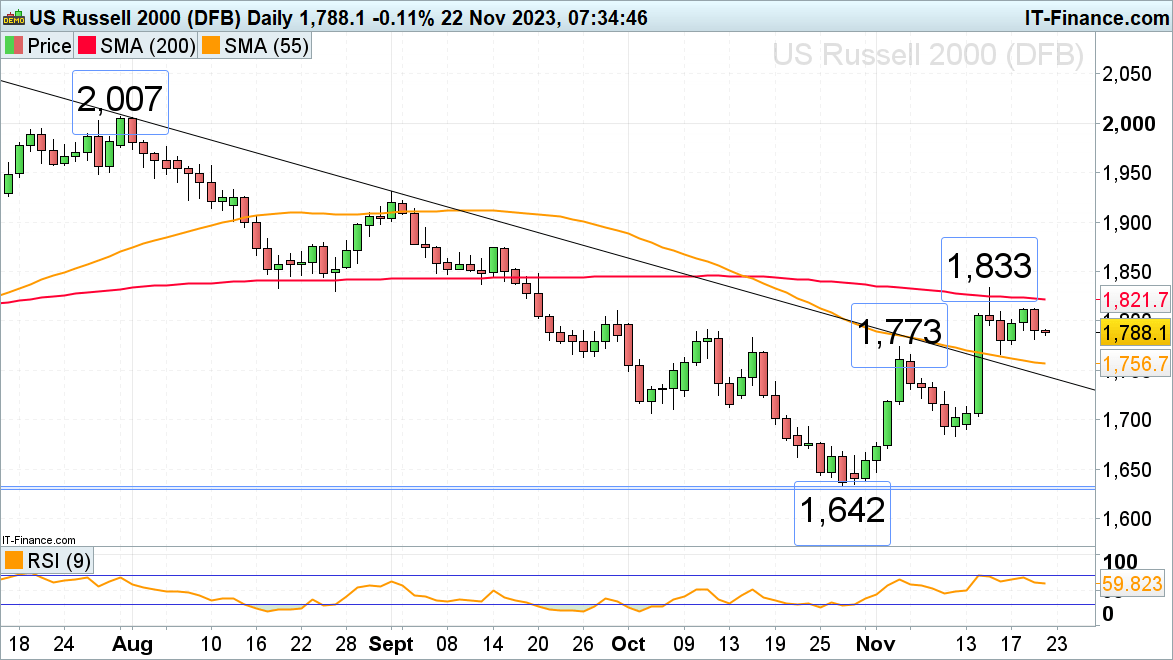
Russell 2000 range trades below its 1,833 current November high
The Russell 2000, the great underperformer of US stock indices with only a 2% positive performance year-to-date, has been trading in a tight sideways range below its 200-day simple moving average (SMA) and last week’s high at 1,822 to 1,833 ahead of Thanksgiving.
While Thursday’s low at 1,767 underpins, the October-to-November uptrend remains intact. Below it the 55-day simple moving average (SMA) at 1,757 may also act as support, were it to be revisited. Immediate resistance can be seen at Monday’s 1,813 high.
A rise above the current 1,833 high would engage the mid-September high at 1,874.
Russell 2000 Daily Chart
[ad_2]
لینک منبع : هوشمند نیوز
 آموزش مجازی مدیریت عالی حرفه ای کسب و کار Post DBA آموزش مجازی مدیریت عالی حرفه ای کسب و کار Post DBA+ مدرک معتبر قابل ترجمه رسمی با مهر دادگستری و وزارت امور خارجه |  آموزش مجازی مدیریت عالی و حرفه ای کسب و کار DBA آموزش مجازی مدیریت عالی و حرفه ای کسب و کار DBA+ مدرک معتبر قابل ترجمه رسمی با مهر دادگستری و وزارت امور خارجه |  آموزش مجازی مدیریت کسب و کار MBA آموزش مجازی مدیریت کسب و کار MBA+ مدرک معتبر قابل ترجمه رسمی با مهر دادگستری و وزارت امور خارجه |
 مدیریت حرفه ای کافی شاپ |  حقوقدان خبره |  سرآشپز حرفه ای |
 آموزش مجازی تعمیرات موبایل آموزش مجازی تعمیرات موبایل |  آموزش مجازی ICDL مهارت های رایانه کار درجه یک و دو |  آموزش مجازی کارشناس معاملات املاک_ مشاور املاک آموزش مجازی کارشناس معاملات املاک_ مشاور املاک |
برچسب ها :ahead ، Consolidate ، FTSE ، RUSSELL ، Thanksgiving
- نظرات ارسال شده توسط شما، پس از تایید توسط مدیران سایت منتشر خواهد شد.
- نظراتی که حاوی تهمت یا افترا باشد منتشر نخواهد شد.
- نظراتی که به غیر از زبان فارسی یا غیر مرتبط با خبر باشد منتشر نخواهد شد.


ارسال نظر شما
مجموع نظرات : 0 در انتظار بررسی : 0 انتشار یافته : 0