


Article by IG Chief Market Analyst Chris Beauchamp
FTSE 100, DAX 40, S&P 500 – Analysis and Charts
FTSE 100 clings on above 7330
An attempt to continue Monday’s bounce hit some selling yesterday, helped along by the poor reaction to BP’s results. A close above 7350 would be needed to indicate that the buyers have been able to muster fresh strength, and a close above 7400 might then suggest that a low has been formed.
This short-term bullish view would be negated with a close below 7250. This then leaves only the 7200 lows of March and the summer before the index.
FTSE 100 Daily Chart

See Daily and Weekly FTSE Changes in Sentiment
| Change in | Longs | Shorts | OI |
| Daily | 10% | -18% | 3% |
| Weekly | 10% | -24% | 1% |
Dax little-changed after two-day bounce
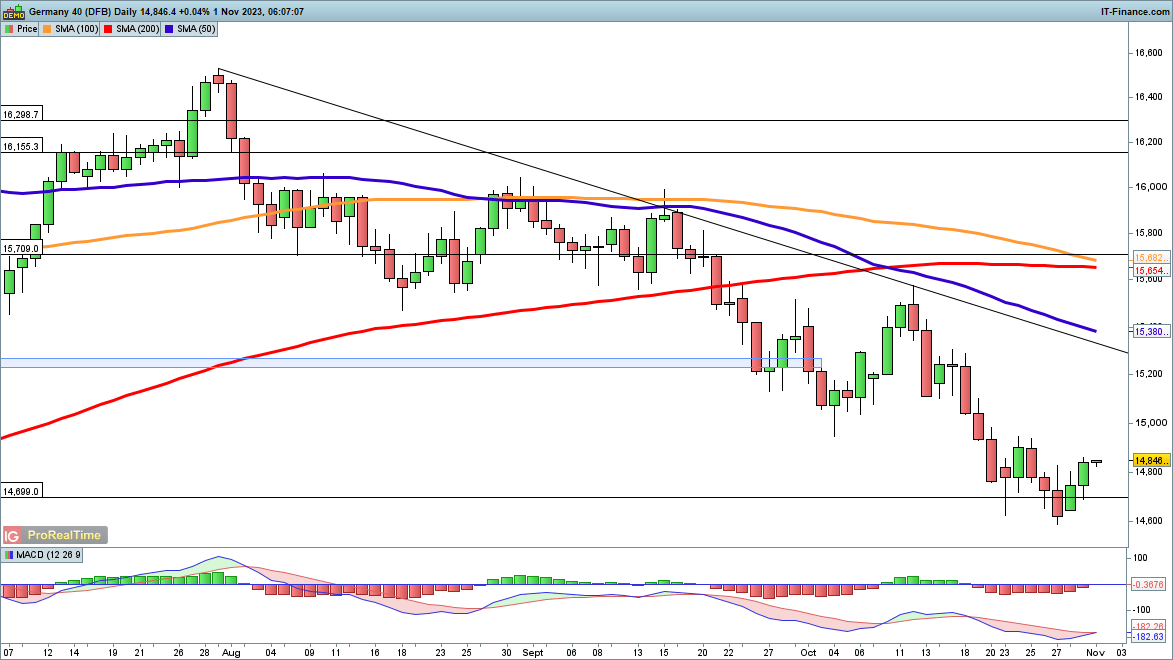
Tuesday saw the index develop further bullish strength, albeit from a lower low.Further gains would target 15,000, and from there, trendline resistance from the August peak would be the next target, in a more extended version of the early August rally.
For the moment a short-term low has been created, and a reversal below 14,600 would be needed to indicate a renewed bearish view.
DAX40 Daily Chart
Recommended by IG
Get Your Free Top Trading Opportunities Forecast
S&P 500 rally slows
Continued gains saw the index move back above its Monday highs, as the price rallied from a lower low. The next target is the 200-day SMA, which acted as resistance in late October. A close above this opens the path to trendline resistance from the September highs, and then on to the 50—day SMA, and then the October peak around 4395.
Sellers will want a reversal back below 4150 to negate this possible bullish view.
S&P 500 Daily Chart


 آموزش مجازی مدیریت عالی و حرفه ای کسب و کار DBA









ارسال نظر شما
مجموع نظرات : 0 در انتظار بررسی : 0 انتشار یافته : 0