

Article by IG Chief Market Analyst Chris Beauchamp
FTSE 100, DAX 40 and Dow Jones Analysis and Charts
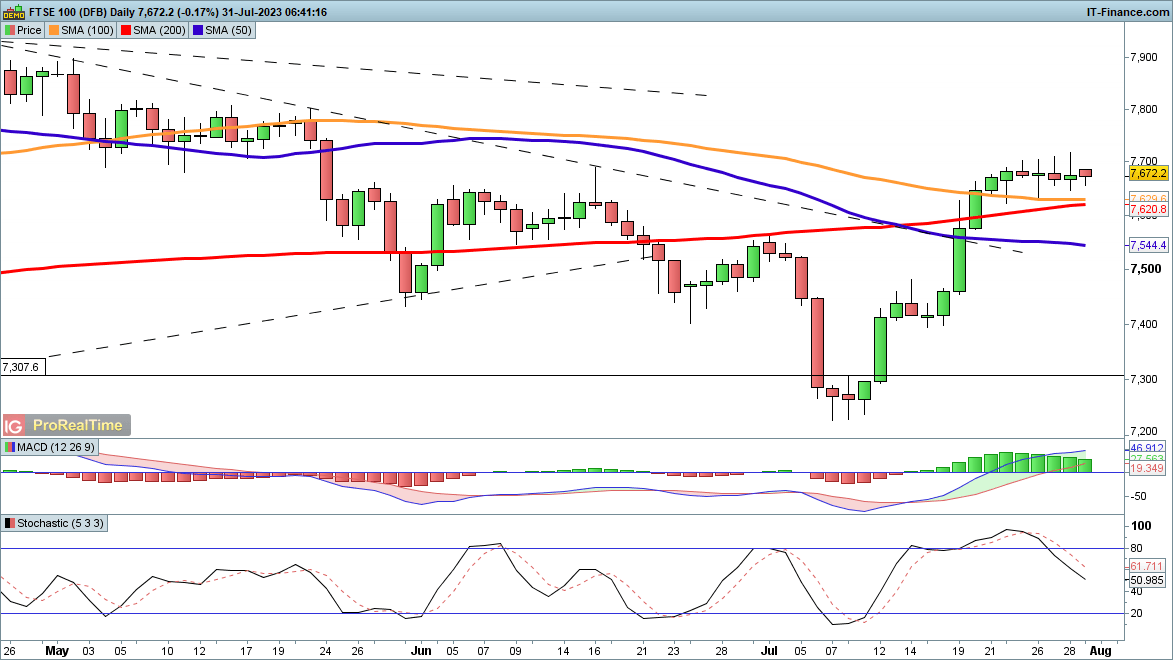
FTSE 100 targets 7700 again
Gains stalled last week below 7700, after an impressive run higher for the index. Bulls will want to see a daily close above 7700 in order to open the way to more upside in the direction of 7800 and then 7930. A recovery of these two levels helps to revive a bullish view after the losses of May and June.
So far losses have been contained around 7630 so a close below this level might help to reinforce a short-term bearish view.
FTSE 100 Daily Price Chart
Recommended by IG
Traits of Successful Traders
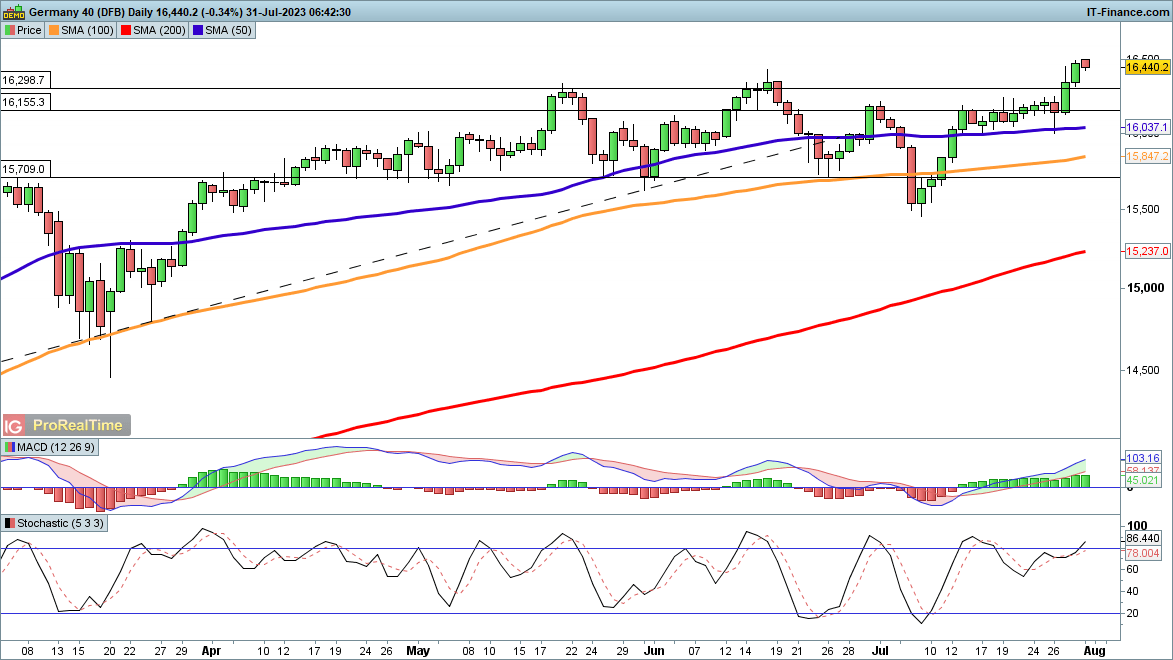
DAX 40 at new 2023 high
The index succeeded in hitting a new record closing high, after months of consolidation. This now puts the buyers back in charge, so long as the price holds above 16,000. After recovering from the lows of June a more bullish view prevails. A close back below 16,100 would suggest the consolidation would continue.
It would need a move back below 15,700 to suggest that a near-term bearish view prevails.
DAX 40 Daily Price Chart
Foundational Trading Knowledge
Macro Fundamentals
Recommended by IG
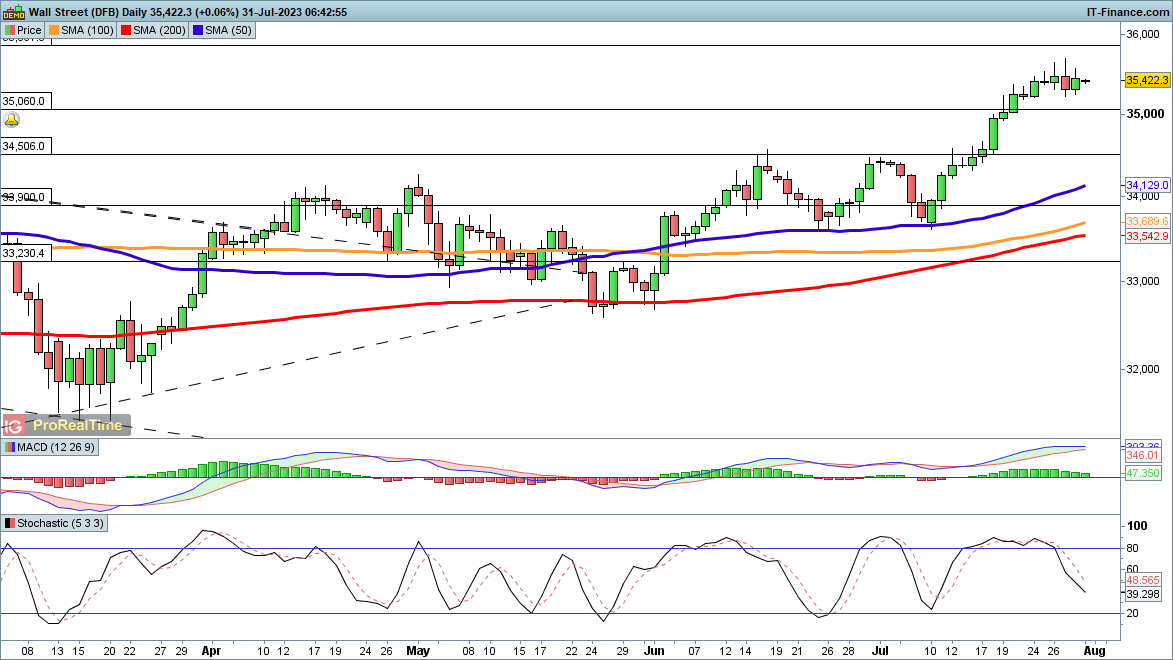
Dow Jones holds close to 2023 high
Last week saw the index reach a new high for the year, both intraday and on a closing basis.After bottoming out in March, the index has succeeded in creating higher lows in May and July. The last three weeks have seen the index rally by over 1500 points, bouncing off the 50-day SMA. The next levels to watch become the February 2022 high at 35,860, and then on to 36,465, and then the record high at 36,954.
A pullback could target the 50-day SMA if the 50-day SMA is lost.
Dow Jones Daily Price Chart

 آموزش مجازی مدیریت عالی و حرفه ای کسب و کار DBA


ارسال نظر شما
مجموع نظرات : 0 در انتظار بررسی : 0 انتشار یافته : 0