Euro, EUR/USD, 100-day MA Breakout – Technical Update:
- The Euro closed at its lowest since early July on Monday
- EUR/USD also broke under the 100-day moving average
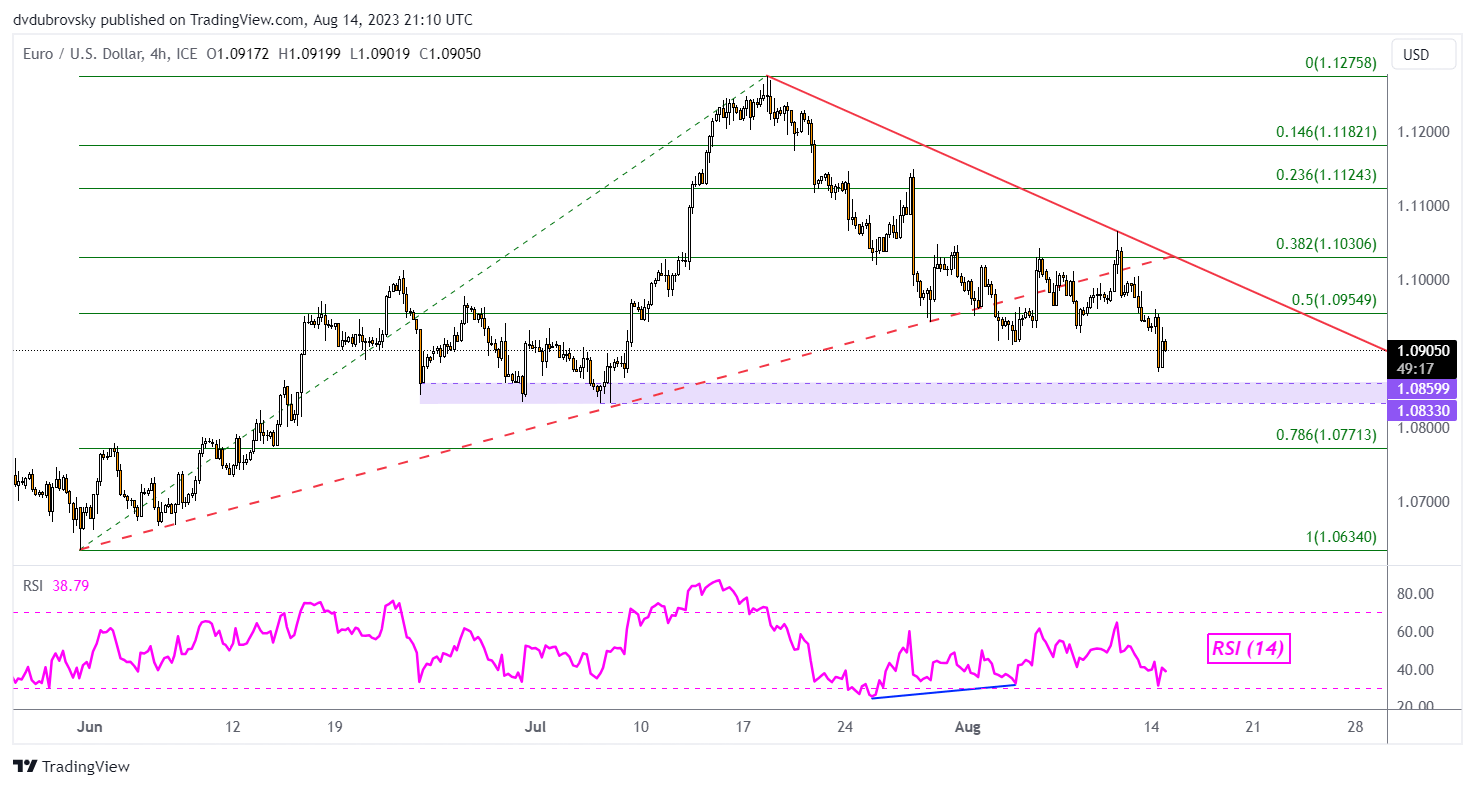
- The 4-hour chart gives us a better idea of support levels
Recommended by Daniel Dubrovsky
Get Your Free EUR Forecast
The US Dollar might be readying to extend losses against the Euro. On the daily chart below, EUR/USD has closed under the 100-day Moving Average (MA). While confirmation is lacking at this time, further downside progress could offer an increasingly bearish technical bias. EUR/USD also closed at its lowest since early July.
From here, immediate support is the July low of 1.0834. A downside breakout exposes lows from May and June. Otherwise, a turn back above the 100-day MA and a false breakout places the focus on immediate resistance at 1.1003, which is the 23.6% Fibonacci extension level. Further gains above that may open the door to revisiting the July high.
Chart Created in TradingView
Zooming in on the 4-hour chart can give us a better idea of how the near-term trend is shaping up. On this timeframe, we can see how EUR/USD confirmed a breakout above near-term rising support from June. Meanwhile, falling resistance from July has been helping maintain the downward technical bias. On this chart, immediate support can be seen better as the 1.0833 – 1.0859 support zone.
If this area holds, it could send prices higher toward a retest of the falling trendline from July. This could maintain the near-term bearish technical bias. Otherwise, a breakout higher exposes the 23.6% Fibonacci retracement level of 1.1124. On the other hand, a breakout and confirmation of immediate support exposes the 78.6% level of 1.0771 as prices fall towards 1.0634.
Recommended by Daniel Dubrovsky
How to Trade EUR/USD

Chart Created in TradingView
— Written by Daniel Dubrovsky, Senior Strategist for DailyFX.com


 آموزش مجازی مدیریت عالی و حرفه ای کسب و کار DBA


ارسال نظر شما
مجموع نظرات : 0 در انتظار بررسی : 0 انتشار یافته : ۰