

Article by IG Chief Market Analyst Chris Beauchamp
Dow Jones, Nasdaq 100, Nikkei 225 Analysis and Charts
Download our Complimentary Top Trades
Recommended by IG
Get Your Free Top Trading Opportunities Forecast
Dow returns to 35,000
The index is back at the 35,000 area, the highs from early September.The past three weeks have seen the market make huge gains, with no sign of a reversal yet in view. A close above 35,100 would then open the way to the July highs at 35,650.
A short-term drop might find support around the 100-day SMA, or further down towards 34,000.
Dow Jones Daily Chart

See How Changes in Retail Sentiment Can Change Price Action
| Change in | Longs | Shorts | OI |
| Daily | -8% | 1% | -1% |
| Weekly | -38% | 18% | -5% |
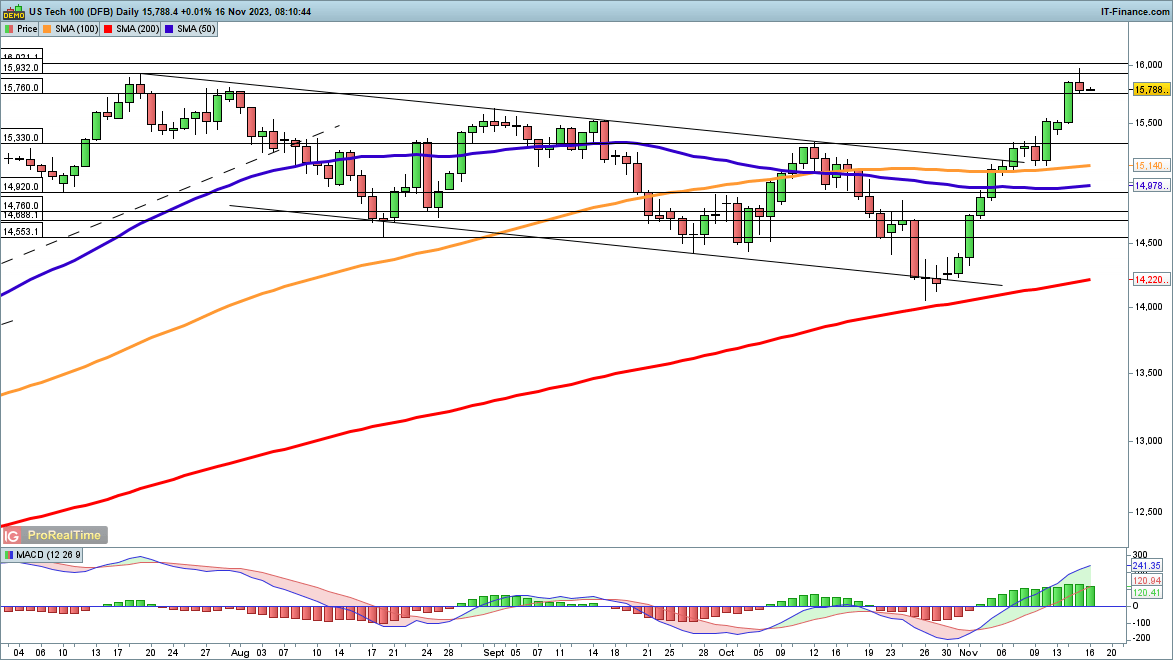
Nasdaq 100 hits new 2023 high
Wednesday’s session briefly saw the index touch the highest level since the beginning of 2022. The surge from the 200-day SMA has witnessed a 13% gain for the index, breaking out of the summer descending channel and opening the way to more upside in the direction of the 2022 highs towards 16,600.
Short-term support might be found around 15,500, the August highs, and then down towards the 100-day SMA.
Nasdaq 100 Daily Chart
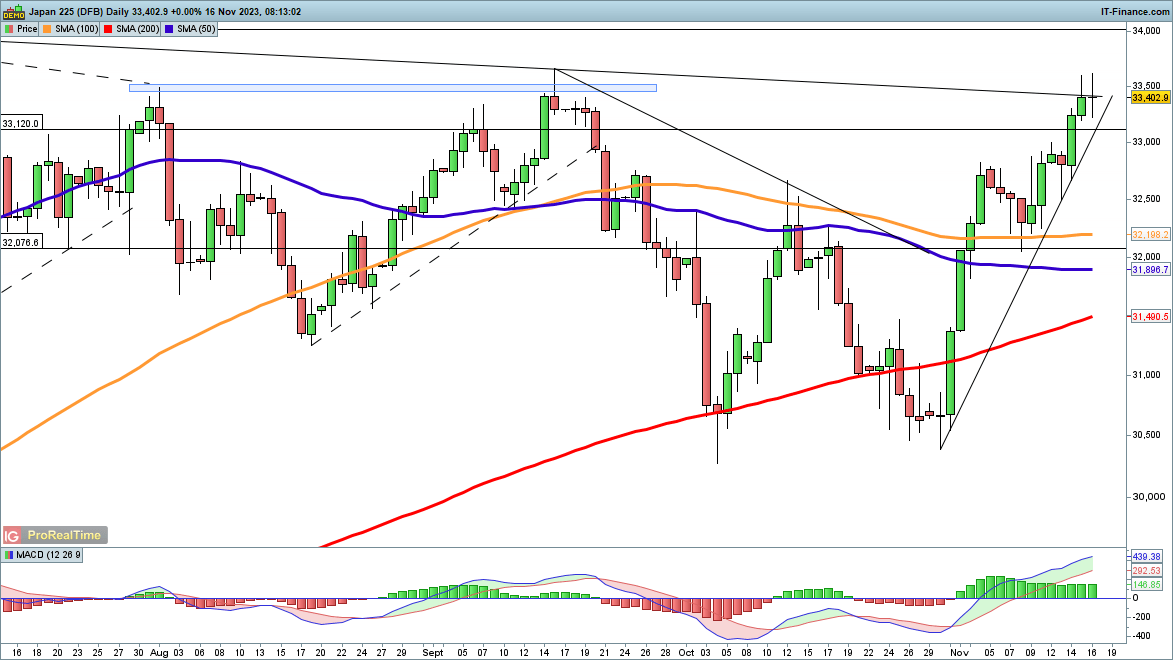
Nikkei 225 reaches trendline resistance
November’s rally has carried the index back to trendline resistance from the June highs.There may be some volatility around this area, which is close to the September lower high, but a close above 33,700 would open the way to the 34,000 highs of June.
In the short-term, the mid-October highs around 32,500 might provide some support if a pullback develops.
Nikkei 225 Daily Chart

 آموزش مجازی مدیریت عالی و حرفه ای کسب و کار DBA


ارسال نظر شما
مجموع نظرات : 0 در انتظار بررسی : 0 انتشار یافته : 0