

Article by IG Chief Market Analyst Chris Beauchamp
Dow Jones, Nikkei 225, Nasdaq 100 Analysis and Charts
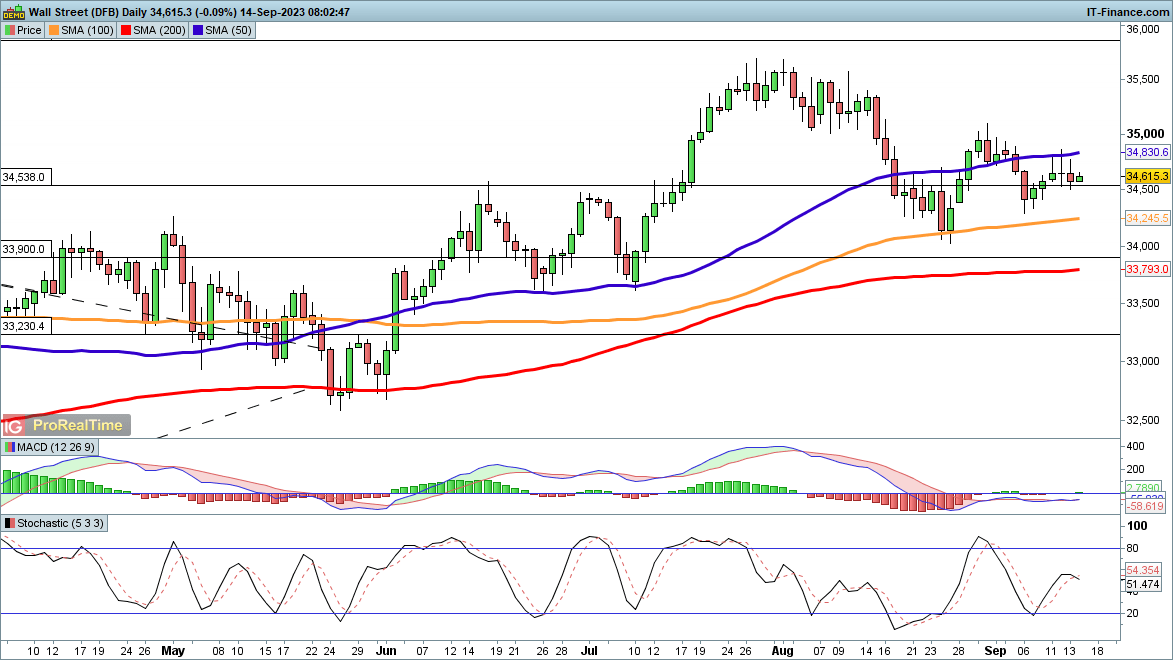
Dow struggles to push higher
The index has spent the week trying to break higher, but gains above 34,700 have proven impossible to sustain. For the moment, while the buyers have not been able to seize control, sellers have been unable to drive the price lower, with 34,540 acting as an area of support. Last week’s low at 34,280, and then the late August low around 34,050 could provide support.
A close above the 50-day SMA would provide a more bullish view and could see the price test the 35,000 level again.
Dow Jones Daily Chart
Recommended by IG
Building Confidence in Trading
Nasdaq 100 holds above 50-day MA
Here the bulls are showing signs of strength, keeping the index above the 50-day SMA and stepping yesterday to hold the price above 15,260.A close above 15,575 might help to catalyze a more bullish view, as it would see the price push on above the late August high. From there, the 15,750 and 15,930 highs from July come into view.
The recovery from the August low is intact, though a drop back below 15,200 would put pressure on that, and potentially open the way to another test of the 100-day SMA and then the August lows around 14,690.
Nasdaq 100 Daily Chart

Trade Smarter – Sign up for the DailyFX Newsletter
Receive timely and compelling market commentary from the DailyFX team
Subscribe to Newsletter
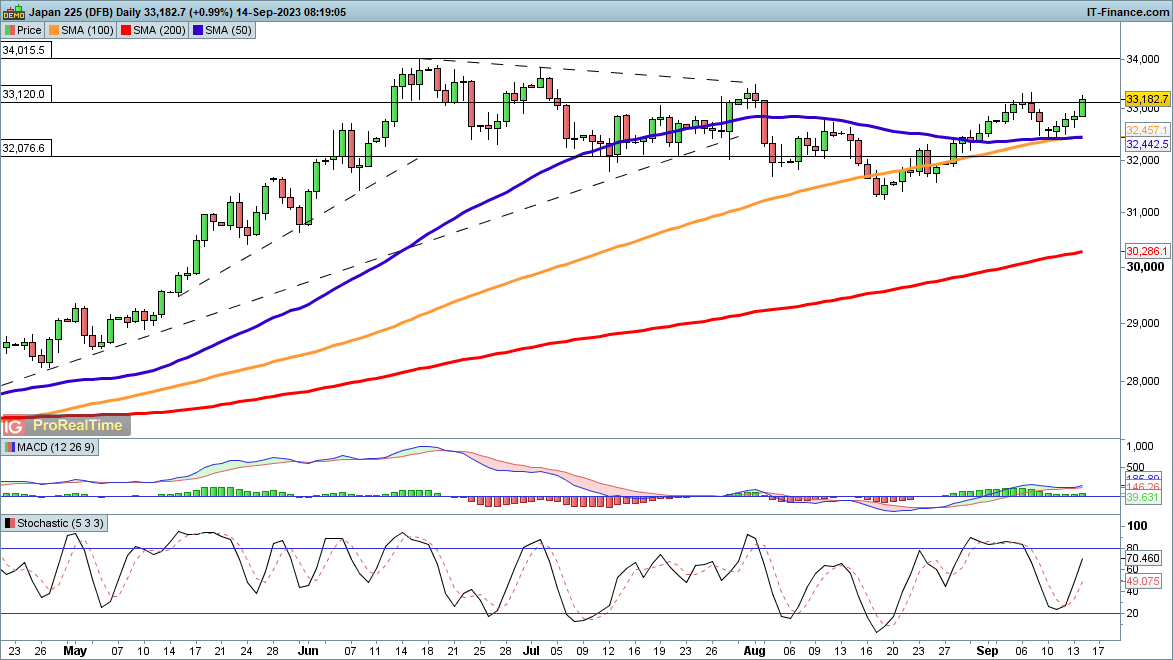
Nikkei 225 surges
Steady gains in the first three days of the week were followed up by a surge on Thursday that has taken the index back to the early September highs.A close above 33,337 would mark a bullish breakout, with the next target being the early August peak at 33,40, followed up by the lower highs of July and then June.
Overall the rally from the August low is still in place, with the bounce of the past week taking place off a higher low. A close back below 32,400 would negate this bullish view in the short term.
Nikkei 225 Daily Chart

 آموزش مجازی مدیریت عالی و حرفه ای کسب و کار DBA


ارسال نظر شما
مجموع نظرات : 0 در انتظار بررسی : 0 انتشار یافته : 0