

Crude Oil, WTI, Retail Trader Positioning, Technical Analysis – IGCS Commodities Update
- Crude oil prices all set for a 4th consecutive monthly gain?
- Still-bearish retail trader exposure offers a bullish outlook
- Prices just barely break above a key zone of resistance
Recommended by Daniel Dubrovsky
How to Trade Oil
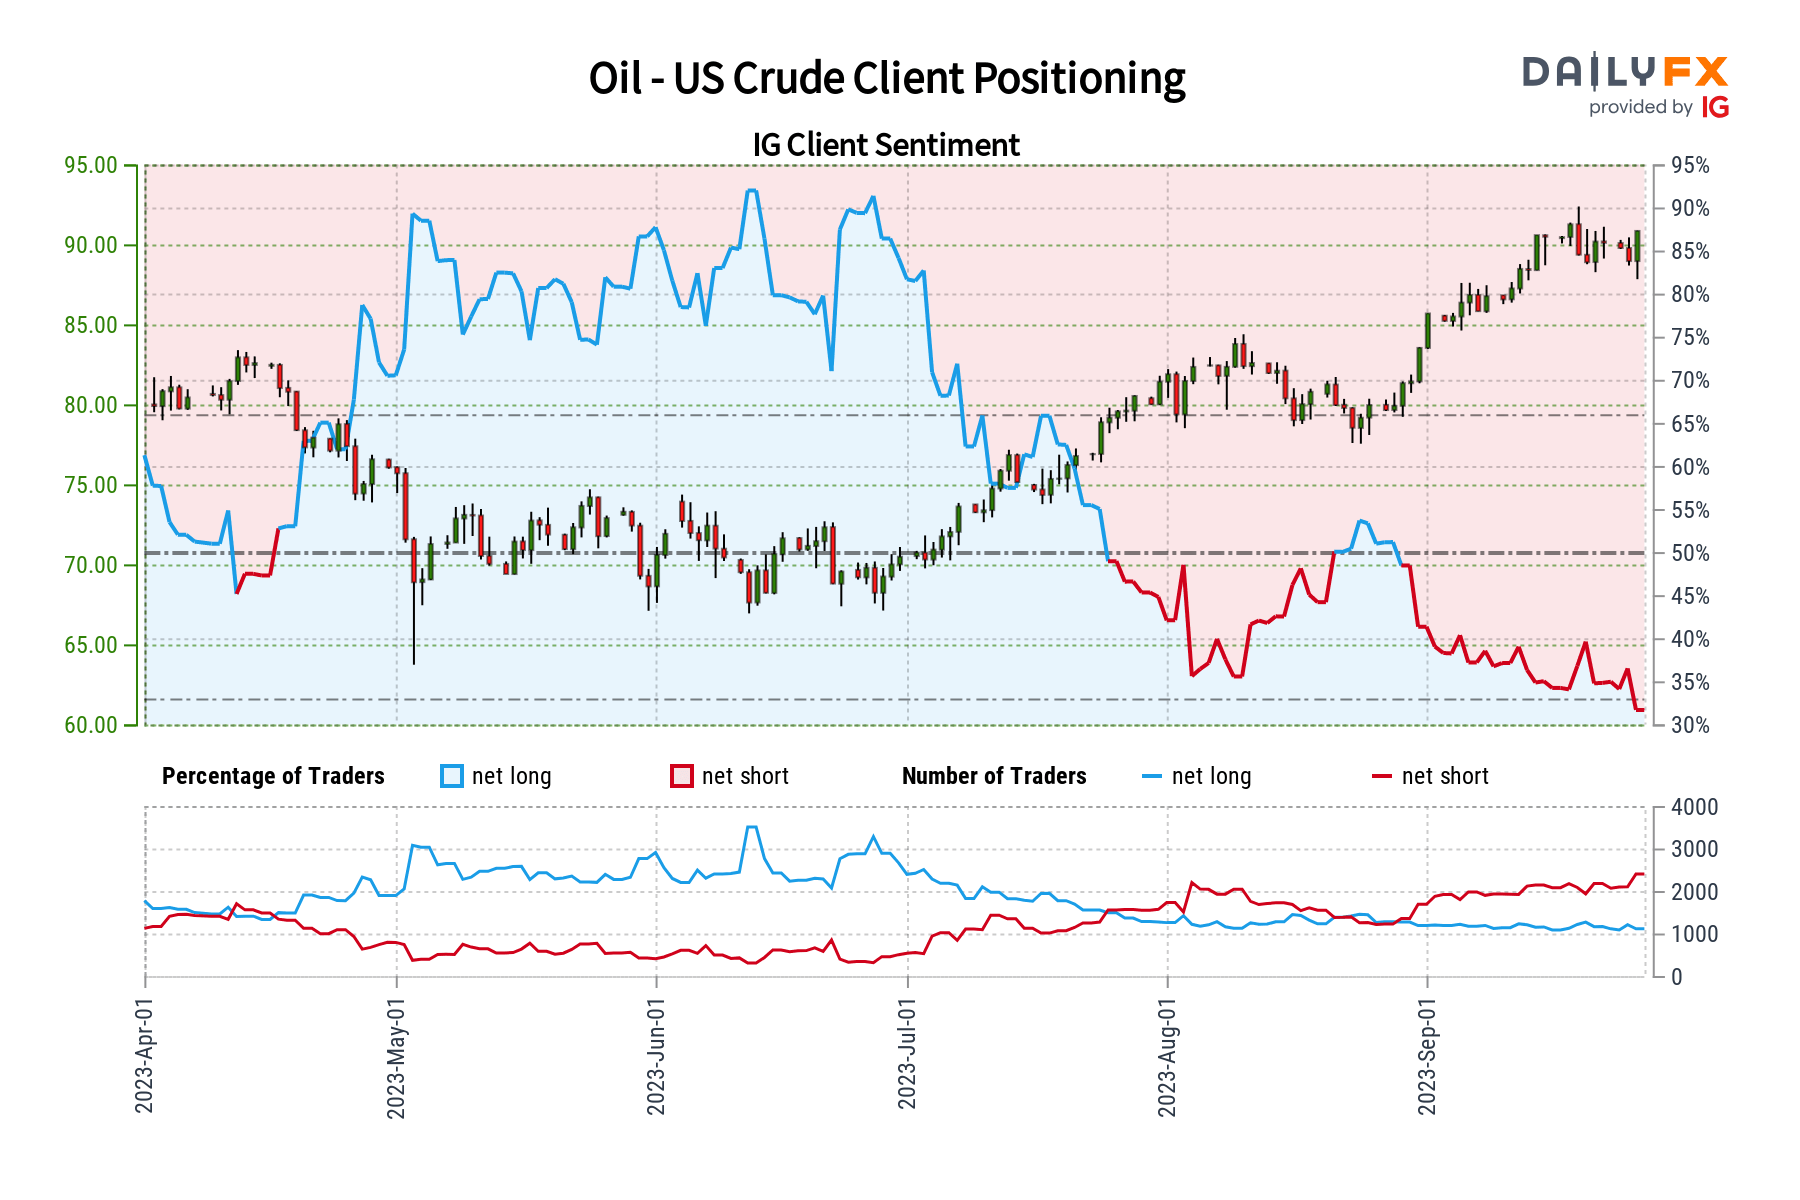
Crude oil prices rocketed higher on Wednesday, soaring 3.6 percent in the most aggressive day since early June. The commodity is on course for a 4th consecutive monthly gain. Meanwhile, retail traders continue increasing bearish exposure. This can be seen by looking at IG Client Sentiment, which tends to function as a contrarian indicator. Will this spell further gains for oil?
Crude Oil Sentiment Outlook – Bullish
According to IGCS, only about 30% of retail traders are net-long crude oil. Since the majority are biased to the downside, this continues to hint that prices may rise down the road. Meanwhile, upside bets have decreased by 10.3% and 16.32% compared to yesterday and last week, respectively. With that in mind, overall exposure and recent changes offer a stronger bullish contrarian trading outlook.
| Change in | Longs | Shorts | OI |
| Daily | -9% | 2% | -2% |
| Weekly | -20% | 26% | 8% |
On the daily chart below, WTI has just barely closed above the 93.72 – 92.43 resistance zone from highs seen in November. That has opened the door to extending the uptrend since earlier this year, exposing the 100% Fibonacci extension level at 95.63. Just beyond that is the August 2022 high of 97.65, which may hold as key resistance.
But, note that there is a negative RSI divergence showing that upside momentum is fading. In the event of a turn lower, dropping through the 93.72 – 92.43 former resistance zone places the focus on the 20-day Moving Average. Just below that is the 61.8% extension at 88.75.
Recommended by Daniel Dubrovsky
The Fundamentals of Breakout Trading
Crude Oil Daily Chart
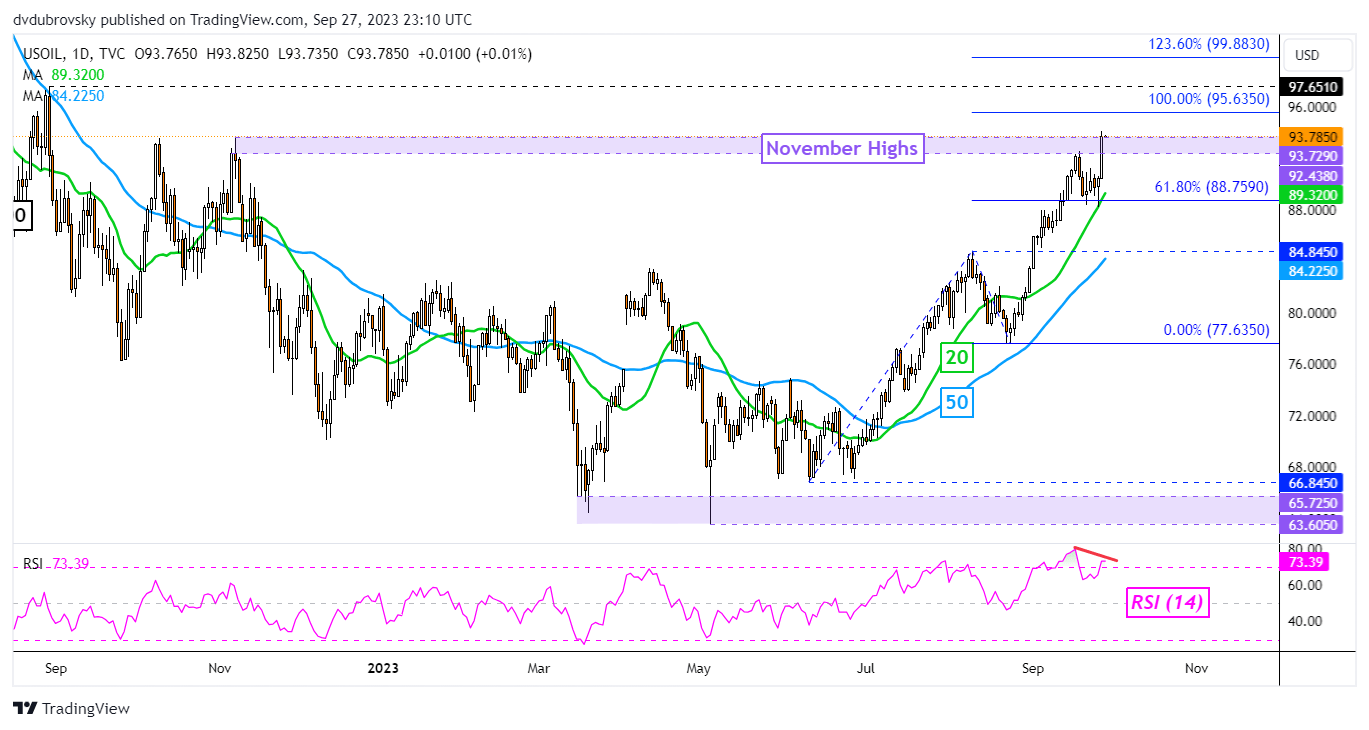
Chart Created in Trading View
— Written by Daniel Dubrovsky, Senior Strategist for DailyFX.com

 آموزش مجازی مدیریت عالی و حرفه ای کسب و کار DBA


ارسال نظر شما
مجموع نظرات : 0 در انتظار بررسی : 0 انتشار یافته : 0