

Crude Oil, WTI, Head & Shoulders – Technical Update:
- Crude oil prices may be readying to extend lower
- Daily chart is maintaining a broader bullish bias
- But, bearish Head & Shoulders in focus on 4-hour
Recommended by Daniel Dubrovsky
Get Your Free Oil Forecast
Daily Chart
WTI crude oil prices may be reading to extend lower following recent technical developments, especially on the 4-hour chart. For now, let us focus on the daily setting. Oil is currently on course for a second consecutive weekly loss, which has been fairly unusual for WTI given price action since May. Is this a sign of technical exhaustion?
In recent days, WTI left behind new support around 78.99 after confirming a breakout under the rising trendline from June. This also followed the emergence of a Bearish Engulfing candlestick pattern. Meanwhile, resistance was established around 81.56. Below current price action, a bullish Golden Cross emerged between the 50- and 100-day Moving Averages (MAs).
So, while the near-term technical landscape is appearing bearish, the broader upside bias remains focused higher. But, there are brewing signs of potentially more bearish price action to come.
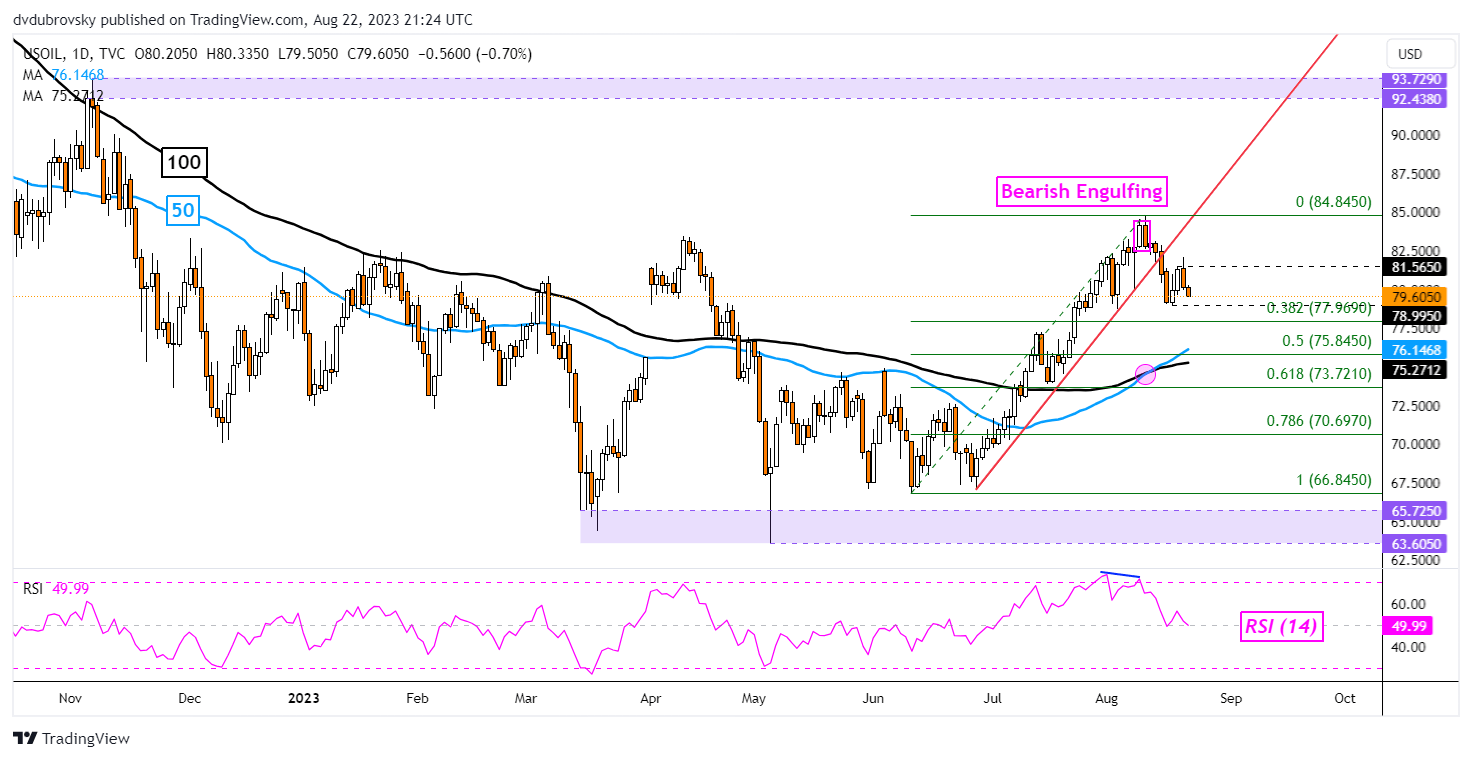
Chart Created in TradingView
4-Hour Chart
Using the 4-hour setting below, we can see the outlines of a Bearish Head & Shoulders chart formation taking shape. Recently, the peak of the right shoulder was established around 81.69. The neckline seems to be around 79.02.
Now, prices are sitting just above the bearish chart formation. Confirming a breakout lower could open the door to extending lower. That would place the focus on the 77.30 inflection point before the July 17th low of 73.81 comes into focus.
Otherwise, pushing back above the right shoulder may open the door to revisiting the August 10th high of 84.85.
Recommended by Daniel Dubrovsky
How to Trade Oil
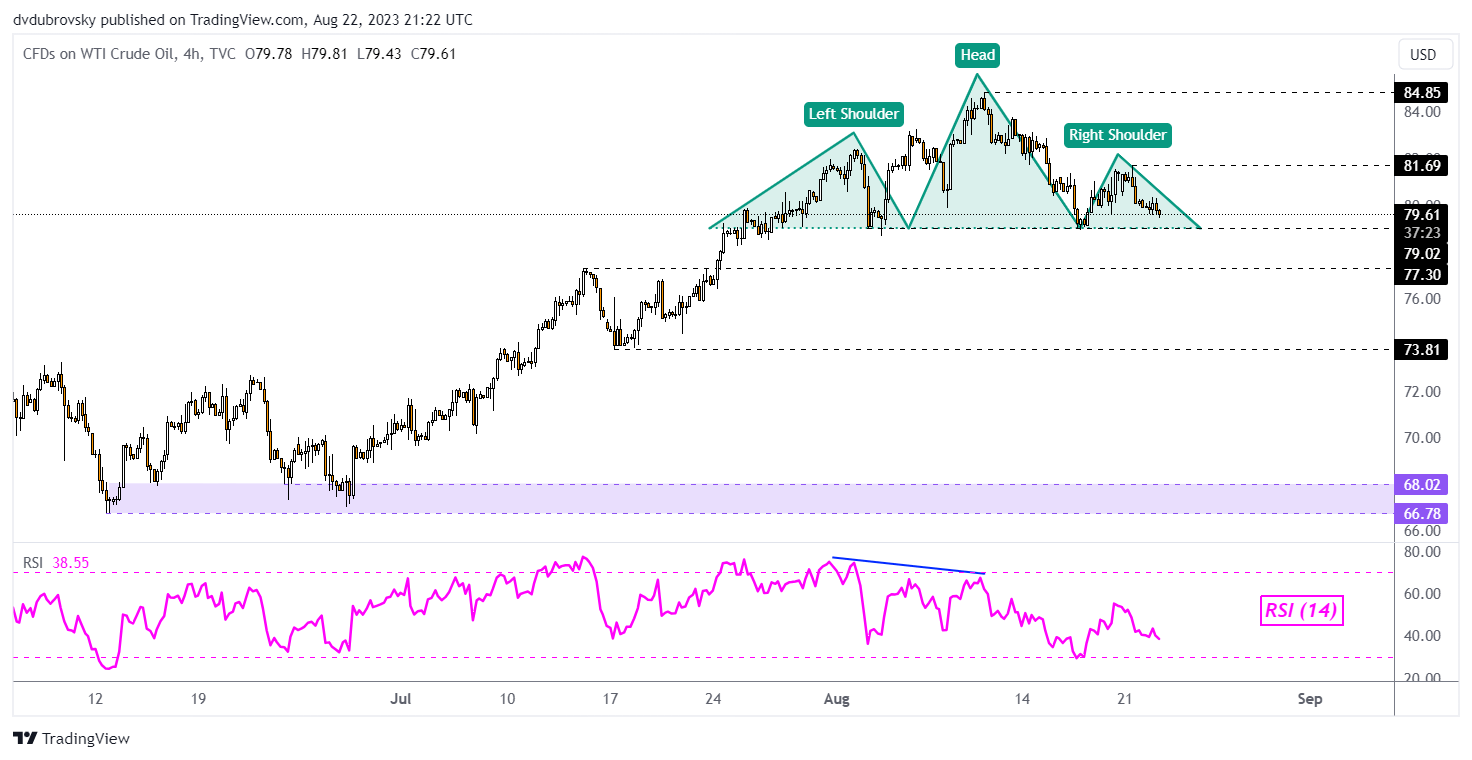
Chart Created in TradingView
— Written by Daniel Dubrovsky, Strategist for DailyFX.com

 آموزش مجازی مدیریت عالی و حرفه ای کسب و کار DBA


ارسال نظر شما
مجموع نظرات : 0 در انتظار بررسی : 0 انتشار یافته : 0