
Crude Oil Prices Lower Again As Markets Fret Chinese Demand
[ad_1] Oil Price Analysis and Charts Crude oil prices sink again End-demand worries continue to overshadow a more bullish supply picture The technical charts may point to further short-term losses Recommended by David Cottle How to Trade Oil Crude oil prices struggled again on Wednesday in Europe, extending consistent falls seen since mid-August. The energy

[ad_1]
Oil Price Analysis and Charts
- Crude oil prices sink again
- End-demand worries continue to overshadow a more bullish supply picture
- The technical charts may point to further short-term losses
Recommended by David Cottle
How to Trade Oil
Crude oil prices struggled again on Wednesday in Europe, extending consistent falls seen since mid-August. The energy market remains glumly concerned about demand in both China and the United States, albeit for widely divergent reasons.
China clearly represents the greater difficulty as evidence mounts that its post-Covid recovery has faded out already. Moreover, Beijing’s monetary response to this month’s raft of weak data has so far underwhelmed global markets. Investors want to see the voltage turned right up as soon as possible, to stop incipient deflation from digging in, but the People’s Bank of China merely trimmed short-term loan rates last week. ‘A start, but not nearly enough,’ seems to have been the markets’ verdict.
By contrast the US economy is performing rather well, overall, but this very performance has investors concerned that above-target inflation will need either more interest rate rises, or demand-sapping higher rates for longer, if it’s going to be tamed. Naturally, those higher rates would put the brakes on economic activity and, thereby, energy prices.
These worries about the world’s number one and two national economies overshadow what might without them be seen as quite price-positive news for energy. Cuts from major producers have been extended into September, and global oil demand was revealed by the International Energy Agency to have reached another all-time high in this year’s second quarter.
Still, for now, demand concerns dominate, and they’re unlikely to lift anytime soon. This week’s market highlights will include weekly oil inventory numbers from the US Energy Information Administration and Thursday’s look at durable goods orders. The Kansas City’s Federal Reserve’s Jackson Hole Symposium of central bankers will also be in focus, as it has in the past been the venue for major speeches by the world’s monetary heavyweights.
Jackson Hole Preview: Where to Next for the Fed?
Recommended by David Cottle
Traits of Successful Traders
US Crude Oil Technical Analysis
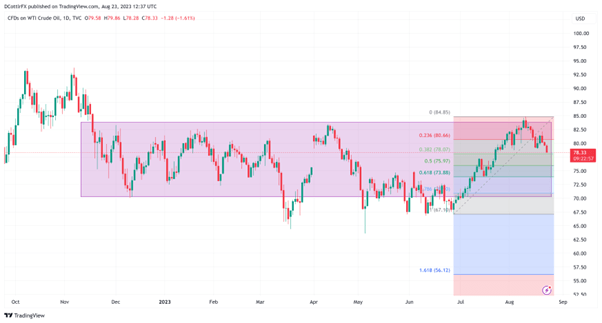
US Crude Prices Daily Chart Compiled Using TradingView
The West Texas Intermediate crude benchmark daily chart shows prices still in a broad band between the low of December 9 at $70.30 and the peak of April 12 at $83.50. The market is inclined to trade back into that band very rapidly whenever it leaves it, a phenomenon seen on fewer than seven occasions.
It’s possible that this tendency has gone unchallenged for longer than it might thanks to a long, northern-hemisphere summer trading lull, but it’s a notable feature of the market even so, with the timing and direction of a conclusive break a likely long-term directional cue.
There’s no immediate sign of that, however, but a near-term ‘head and shoulders’ pattern seems to be forming quite clearly, bringing a challenge for oil bulls should it be confirmed. This pattern suggests that the market may be topping out, with the focus likely on mid-July’s lows in the $73/barrel area should it head below recent lows.
Any gains above the current ‘right shoulder’ top of $82.02 would put August 9’s high of $84.51 back in the bulls’ sights.
Immediate Fibonacci retracement support of the rise from June 28 to the peak of August 10 comes in very close to the current market price at $78.07.
See how IG Clients are positioned in Oil
| Change in | Longs | Shorts | OI |
| Daily | 10% | -10% | -1% |
| Weekly | 7% | -24% | -10% |
–By David Cottle for DailYFX
[ad_2]
لینک منبع : هوشمند نیوز
 آموزش مجازی مدیریت عالی حرفه ای کسب و کار Post DBA آموزش مجازی مدیریت عالی حرفه ای کسب و کار Post DBA+ مدرک معتبر قابل ترجمه رسمی با مهر دادگستری و وزارت امور خارجه |  آموزش مجازی مدیریت عالی و حرفه ای کسب و کار DBA آموزش مجازی مدیریت عالی و حرفه ای کسب و کار DBA+ مدرک معتبر قابل ترجمه رسمی با مهر دادگستری و وزارت امور خارجه |  آموزش مجازی مدیریت کسب و کار MBA آموزش مجازی مدیریت کسب و کار MBA+ مدرک معتبر قابل ترجمه رسمی با مهر دادگستری و وزارت امور خارجه |
 مدیریت حرفه ای کافی شاپ |  حقوقدان خبره |  سرآشپز حرفه ای |
 آموزش مجازی تعمیرات موبایل آموزش مجازی تعمیرات موبایل |  آموزش مجازی ICDL مهارت های رایانه کار درجه یک و دو |  آموزش مجازی کارشناس معاملات املاک_ مشاور املاک آموزش مجازی کارشناس معاملات املاک_ مشاور املاک |
- نظرات ارسال شده توسط شما، پس از تایید توسط مدیران سایت منتشر خواهد شد.
- نظراتی که حاوی تهمت یا افترا باشد منتشر نخواهد شد.
- نظراتی که به غیر از زبان فارسی یا غیر مرتبط با خبر باشد منتشر نخواهد شد.


ارسال نظر شما
مجموع نظرات : 0 در انتظار بررسی : 0 انتشار یافته : 0