Oil (Brent, WTI) News and Analysis
- Delayed OPEC+ meeting to take place on Thursday at 13:00 GMT – individual quotas and supply cuts remain central to the meeting
- Brent crude prices head lower after notable rejection at the intersection of the crucial $82 level and the 200 SMA
- WTI flat ahead of OPEC meeting but the potential for a bullish surprise depends on OPEC cuts
- The analysis in this article makes use of chart patterns and key support and resistance levels. For more information visit our comprehensive education library
Delayed OPEC Meeting Set for Thursday as Quota Agreement Nears
Last Wednesday, Brent crude oil was particularly volatile after news of OPEC’s decision to delay their meeting to Thursday this week hit the news wires. Since then, sources have pointed to a difference of opinion in the output levels being discussed for countries that have frequently fallen short of existing output quotas, namely Angola, Nigeria.
The graphic below highlights the difficulty faced by African countries in reaching its output targets due to a lack of infrastructure investment and capacity challenges. OPEC + will begin their meeting at 13:00 GMT on Thursday and the cabal is currently weighing up the option to extend supply cuts into 2024 and reports are even suggesting more aggressive supply cuts given weaker oil prices. OPEC has to navigate the negative effect of the global growth slowdown, mainly expectations of lower future demand and increasing non-OPEC supply (US) weighing on oil prices.
The 4-day ceasefire between Israel and Hamas has been mostly positive and talks about an extended truce continue subject to the release of more hostages. OPEC denied requests from Iran to issue an oil embargo on Israel and the war appears to have had minimal impact on recent oil prices.
Source: S&P Global, PLATTS
Recommended by Richard Snow
Understanding the Core Fundamentals of Oil Trading
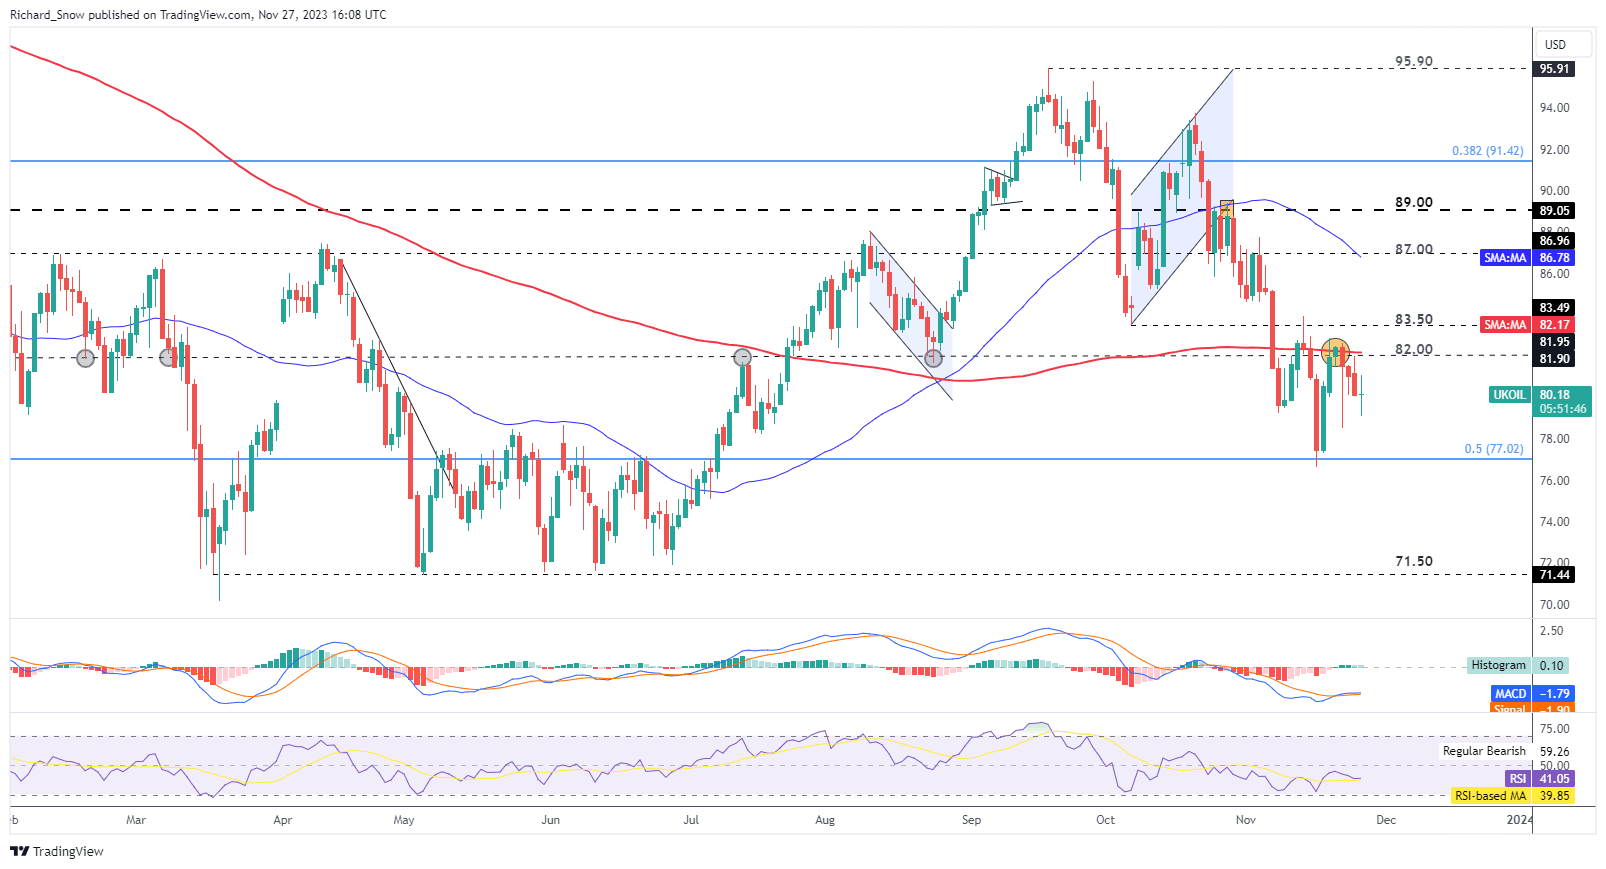
Brent crude oil tested the zone of resistance around the significant $82 level after Wednesday’s increased volatility after the announcement to postpone the November OPEC meeting. The zone comprised of the $82 level which has proved to be a pivot point numerous times in the past and the 200 day simple moving average (SMA). Should bearish momentum pick up from here, there is little to get in the way of the decline, technically. Of course, should OPEC ramp up its supply cuts, this could jolt oil markets higher as markets adjust to a world of lower oil supply.
Resistance remains at $82 with a light level of support at the 50% Fibonacci retracement at $77 – the 50% retracement is generally less significant. Thereafter, support appears all the way at $71.50.
Oil (Brent Crude) Daily Chart

Source: TradingView, prepared by Richard Snow
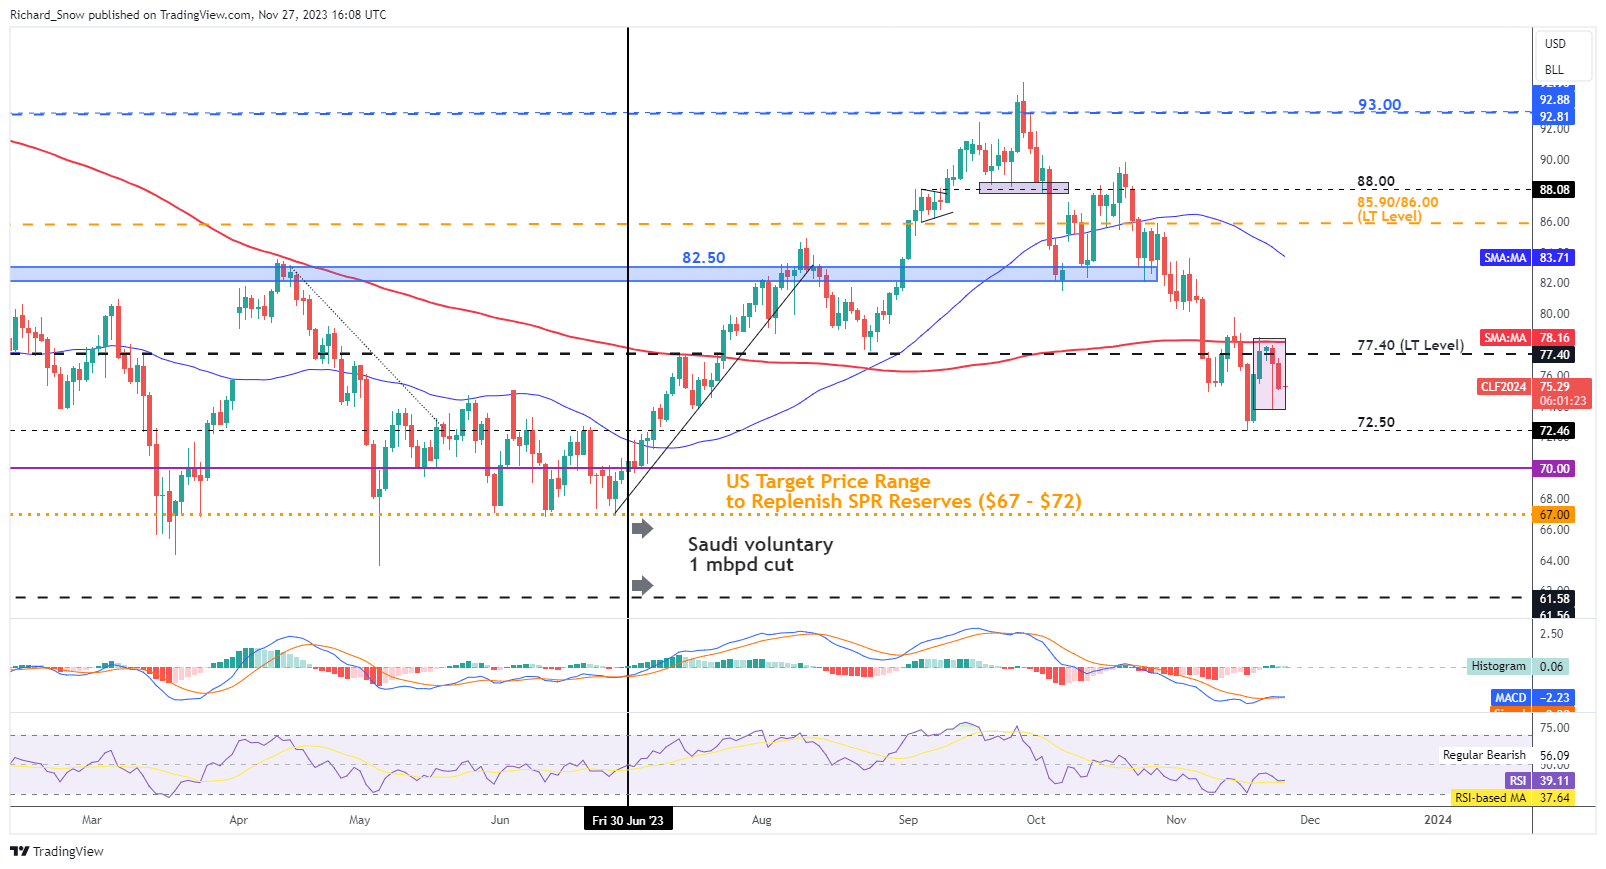
WTI observed a similar path for price action – rejecting a move above the 200 SMA and trading lower ahead of the OPEC meeting. Before the intra-day bullish reversal on Wednesday, the commodity was on track to produce an ‘evening star’ – typically a bearish pattern.
Price action continues to head lower, after trading below the 200 SMA and the significant level of 77.40. Support appears at $72.50.
Oil (WTI) Daily Chart

Source: TradingView, prepared by Richard Snow
Recommended by Richard Snow
How to Trade Oil
— Written by Richard Snow for DailyFX.com
Contact and follow Richard on Twitter: @RichardSnowFX


 آموزش مجازی مدیریت عالی و حرفه ای کسب و کار DBA


ارسال نظر شما
مجموع نظرات : 0 در انتظار بررسی : 0 انتشار یافته : ۰