Oil (Brent Crude, WTI) News and Analysis
- OPEC maintains 2023/24 oil demand growth and economic growth forecasts
- Brent crude oil receives lift after the news but reenters oversold territory
- WTI oil attempts to push higher – US EIA short-term Energy Outlook due later
- The analysis in this article makes use of chart patterns and key support and resistance levels. For more information visit our comprehensive education library
OPEC Maintains Global Economic Growth and Oil Demand Growth for 2023 and 2024
OPEC maintained its forecasts of oil demand growth for this year and next year at 2.4 million barrels per day (mbpd) and 2.2 mbpd respectively. In addition, the group expects global economic growth to also remain unchanged at 2.7% and 2.6%. There was an increase, mainly attributed to rising US production which revealed itself in the form of a 100k upward revision to non-OPEC supply growth for 2023.
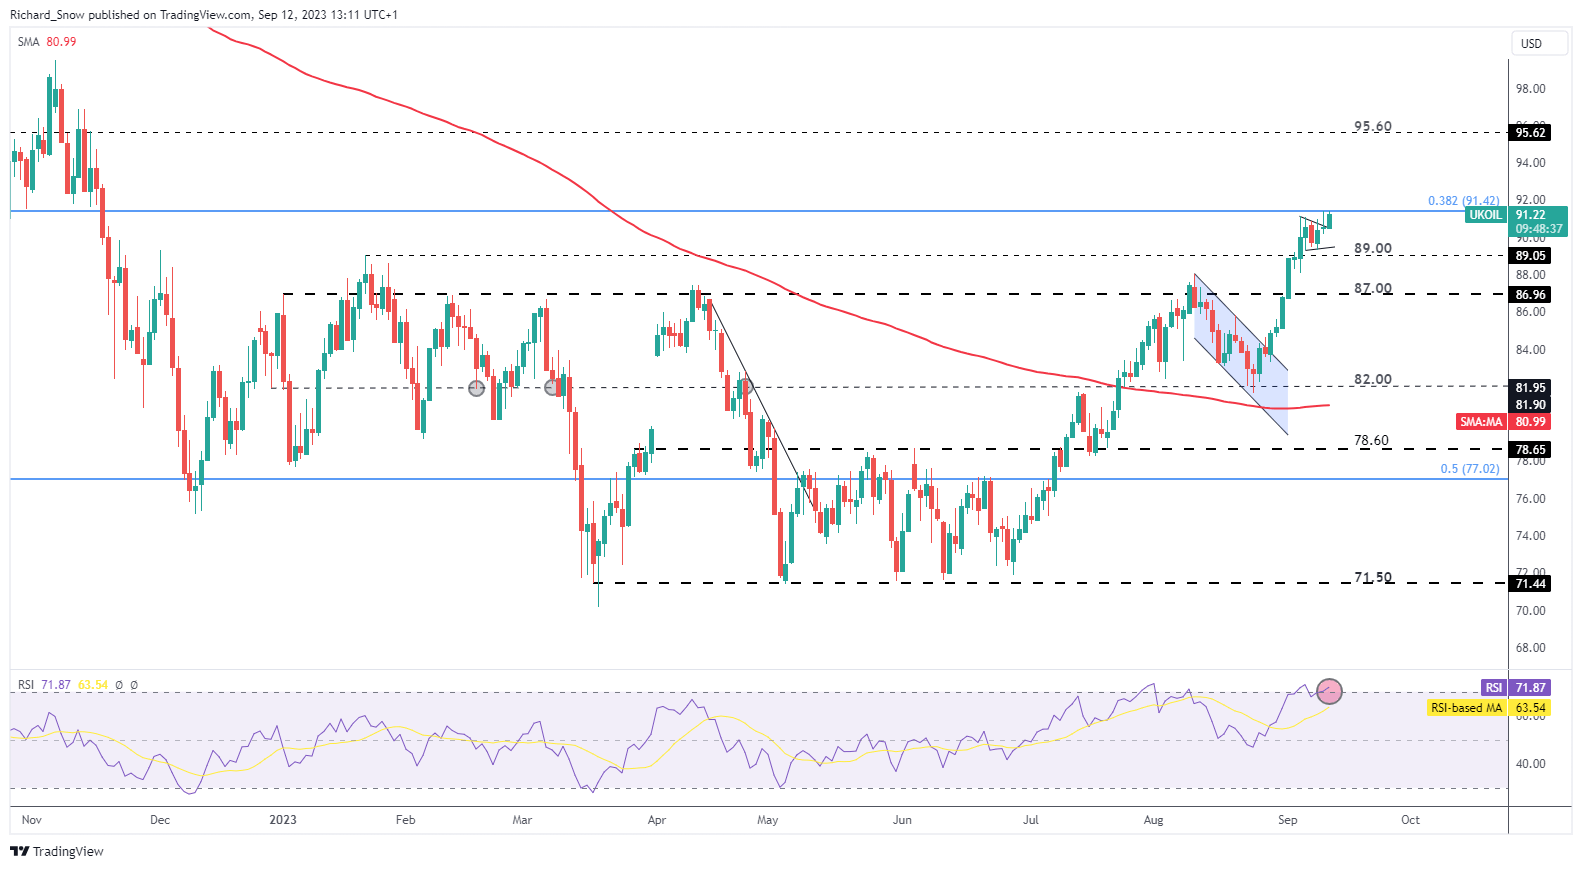
Brent crude oil received a modest boost after the data was released due to what is already a very mature uptrend. The RSI has reentered the overbought zone, sending a warning signal of a potential pullback. However, the oil market remains extremely sensitive to fundamental factors such as Saudi Arabia’s renewed commitment to cut back on supply until the end of this year. A tighter, OPEC-led oil market has fended off increasing supply in the US and concerns of an economic slowdown to ultimately keep prices elevated.
Immediate resistance appears at the 38.2% Fibonacci retracement of the 2020 – 2022 major move ($91.42) with levels to the upside difficult to assess. Nevertheless, $95.60 appears as the next best level of resistance. Support at $89 could come into play should the market eventually experience profit taking and some form of a bullish fatigue but recent price action shows little sign of a slowdown.
Brent Crude Oil Daily Chart

Source: TradingView, prepared by Richard Snow
Recommended by Richard Snow
How to Trade Oil
The weekly chart helps put the massive bullish momentum into perspective. Price has breached the prior zone of resistance that had capped Brent crude prices at the start of the year, in April and also in August. The weekly close above $89 has been rather telling for the oil market and remains in play should we see a pullback from extended levels.
Brent Crude Oil Weekly Chart

Source: TradingView, prepared by Richard Snow
WTI Oil Shapes up for Bullish Continuation Ahead of US EIA Report
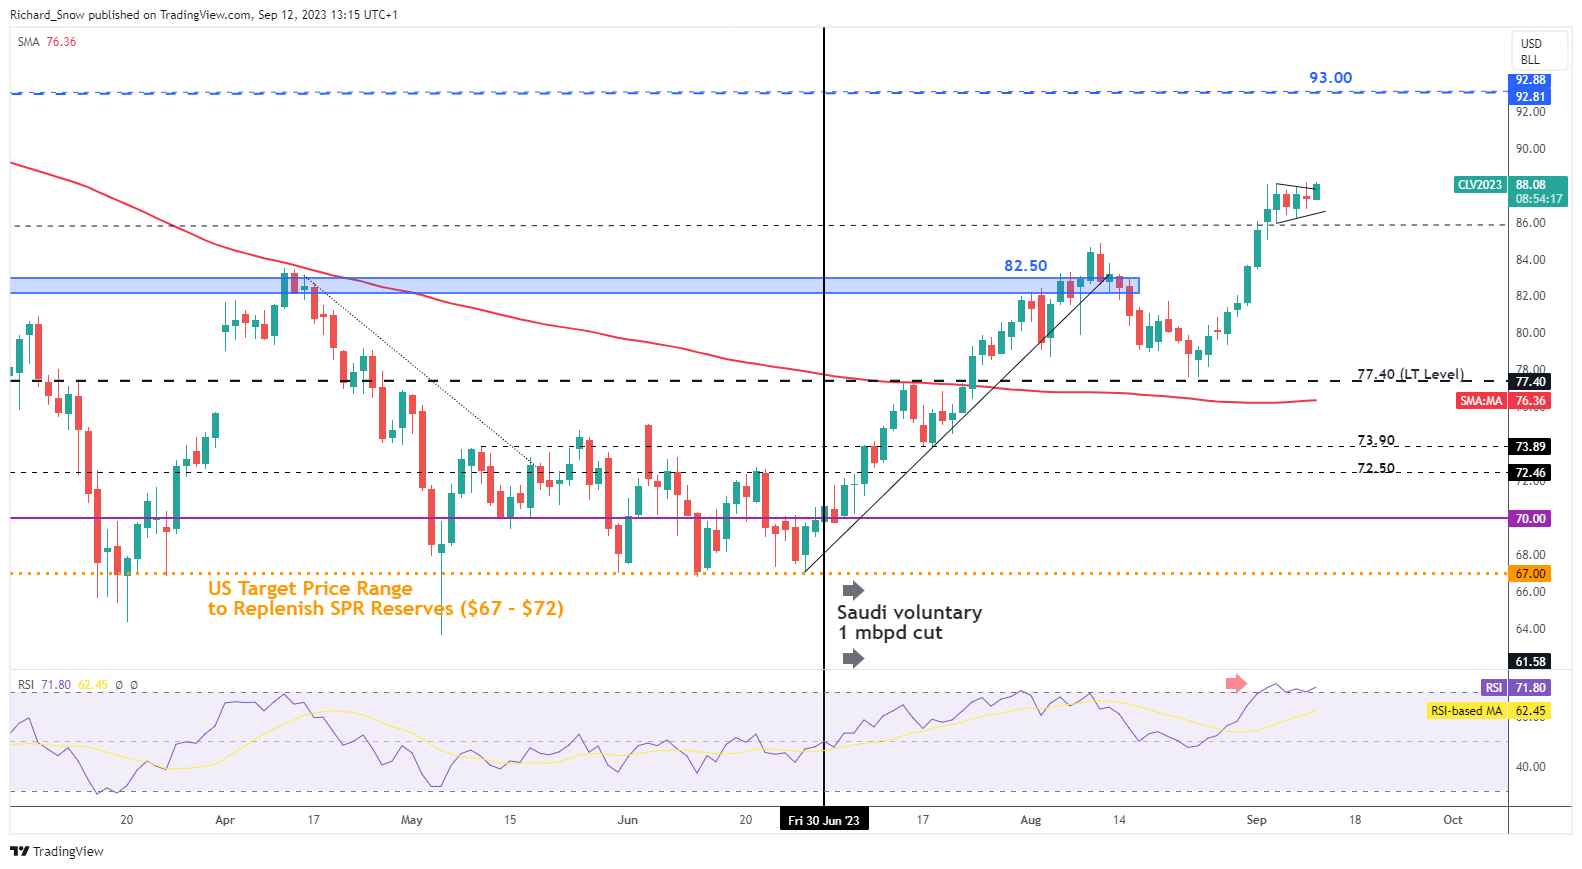
The US Energy Information Agency will release its Short-Term Energy Outlook at 17:00 GMT today. WTI trades in a consolidation pattern similar to a bullish pennant – suggesting the potential for bullish continuation.
Upside levels of interest are also difficult to pinpoint but $93 remains the standout, while $86 holds the lows of recent price action as the consolidation process plays out.
WTI Crude Oil Daily Chart

Source: TradingView, prepared by Richard Snow
| Change in | Longs | Shorts | OI |
| Daily | 3% | 8% | 6% |
| Weekly | 8% | 5% | 6% |
— Written by Richard Snow for DailyFX.com
Contact and follow Richard on Twitter: @RichardSnowFX


 آموزش مجازی مدیریت عالی و حرفه ای کسب و کار DBA


ارسال نظر شما
مجموع نظرات : 0 در انتظار بررسی : 0 انتشار یافته : 0