

Australian Dollar, AUD/USD, AUD/JPY, Symmetrical Triangle – Technical Update:
Recommended by Daniel Dubrovsky
Get Your Free AUD Forecast
The Australian Dollar is hovering just above key support against the US Dollar, which is the 78.6% Fibonacci retracement level at 0.6382. Meanwhile, as prices struggled to break lower, positive RSI divergence emerged, showing that downside momentum was fading. This can at times precede a turn higher.
For now, the 20-day Moving Average (MA) held as resistance, preventing AUD/USD from pushing much higher. Moreover, a bearish Death Cross with the 50-day MA remains in play. The latter could hold as resistance, maintaining the broader downside focus.
If not, a drop through support would expose the November low of 0.6272 on the way toward the 2022 low of 0.617.
Recommended by Daniel Dubrovsky
How to Trade AUD/USD
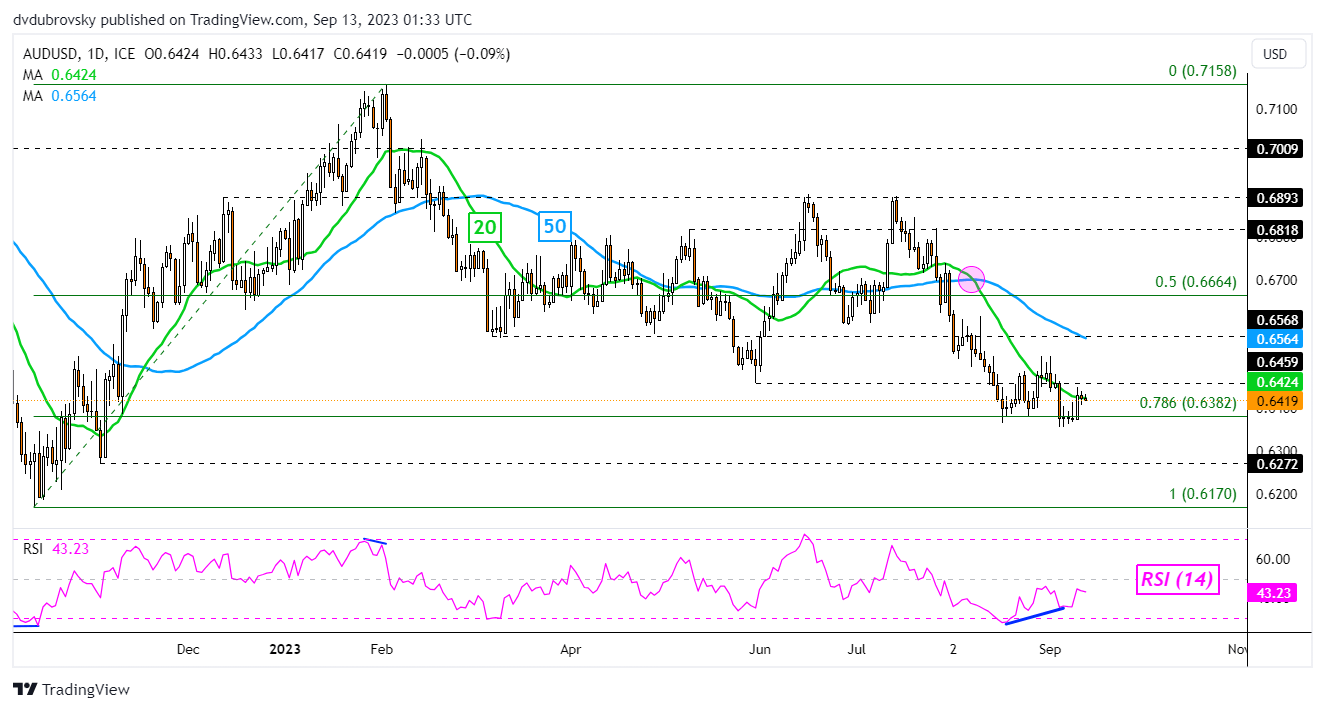
Chart Created in TradingView
Against the Japanese Yen, the Australian Dollar continues to face a Symmetrical Triangle chart formation. This was created via the falling trendline from June and the rising support line from May. AUD/JPY is quickly running out of room to consolidate within this pattern.
The direction of the breakout could be key for the coming trend. A breach above resistance exposes the 23.6% Fibonacci retracement level of 94.93. Confirming a breakout above this point could open the door to a stronger bullish technical conviction.
That would place the focus on the minor 14.6% level at 95.97 before the current 2023 high of 97.67 kicks in. Otherwise, breaking lower places the focus on the 38.2% point at 93.23. Confirming lower offers a stronger bearish technical conviction towards the midpoint of the retracement at 91.86.
| Change in | Longs | Shorts | OI |
| Daily | 17% | -4% | 5% |
| Weekly | 22% | 10% | 16% |
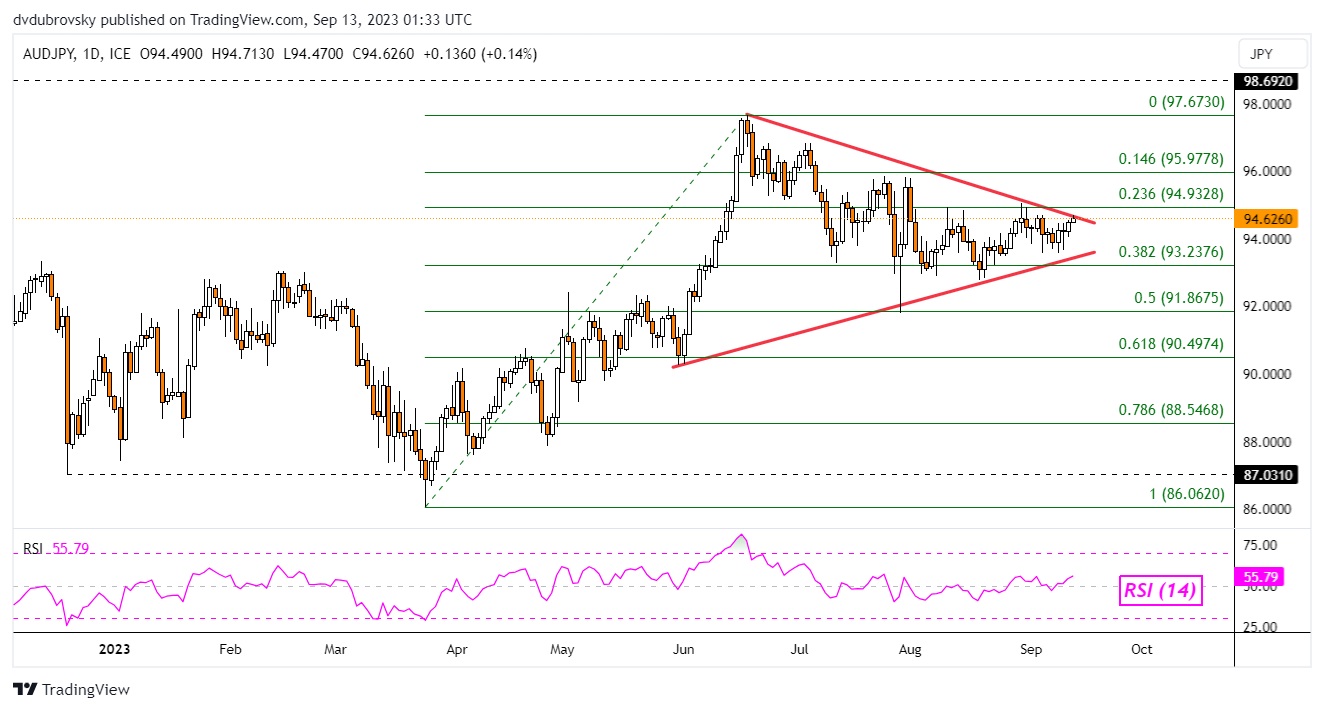
Chart Created in TradingView
— Written by Daniel Dubrovsky, Senior Strategist for DailyFX.com

 آموزش مجازی مدیریت عالی و حرفه ای کسب و کار DBA


ارسال نظر شما
مجموع نظرات : 0 در انتظار بررسی : 0 انتشار یافته : 0