Euro, EUR/USD, Trendline Breakout, RSI Divergence – Technical Update:
- Euro is on the verge of confirming a key downside breakout
- Still, be wary of positive RSI divergence on the 4-hour chart
- What are key levels to watch for in EUR/USD near-term?
Recommended by Daniel Dubrovsky
Get Your Free EUR Forecast
The Euro might be on the verge of confirming a critical bearish breakout against the US Dollar. On the daily chart below, EUR/USD has closed under rising support from late May. Further downside from here would underscore the change in trend, increasingly offering a bearish technical bias for the single currency. That would place the focus on the July low of 1.0834.
Just below that is the 100-day Moving Average (MA). This may hold as key support, maintaining the broader upside bias. Otherwise, extending lower places the focus on the May low of 1.0635. Confirming a push below that opens the door to revisiting the lowest that the Euro has not seen since March. Let us take a closer look at the 4-hour chart to gauge how the near-term trend is shaping up.
Chart Created in TradingView
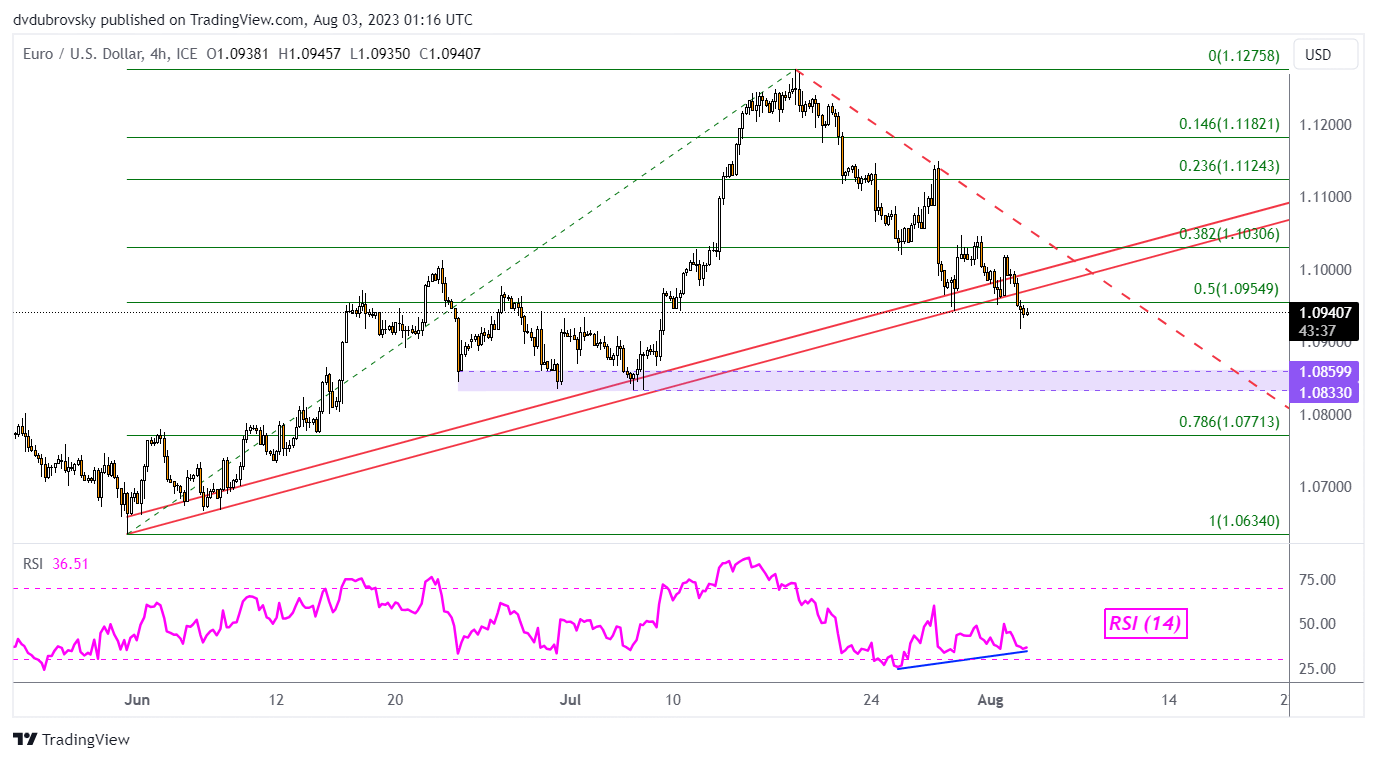
The trendline breakout can be seen better on the 4-hour chart below where support can be made out more accurately as a zone. That said, it is imperative to confirm the breakout from the perspective of the daily chart. In the 4-hour timeframe, we can see that positive RSI divergence is brewing. This is a sign of fading downside momentum which can at times precede a turn higher.
In the event of a false breakout, keep a close eye on the falling trendline from July. This may hold as resistance, maintaining the near-term downside bias. Otherwise, clearing higher exposes the 23.6% Fibonacci retracement level at 1.1124. Clearing the latter may open the door to revisiting the July high of 1.1275.
Recommended by Daniel Dubrovsky
How to Trade EUR/USD

Chart Created in TradingView
— Written by Daniel Dubrovsky, Senior Strategist for DailyFX.com


 آموزش مجازی مدیریت عالی و حرفه ای کسب و کار DBA


ارسال نظر شما
مجموع نظرات : 0 در انتظار بررسی : 0 انتشار یافته : ۰