

Gold, Retail Trader Positioning, Technical Analysis – IGCS Update
- Gold prices weakened for 4 consecutive weeks
- Retail traders continue to become more bullish
- What are key levels to watch for in XAU/USD?
Recommended by Daniel Dubrovsky
Get Your Free Gold Forecast
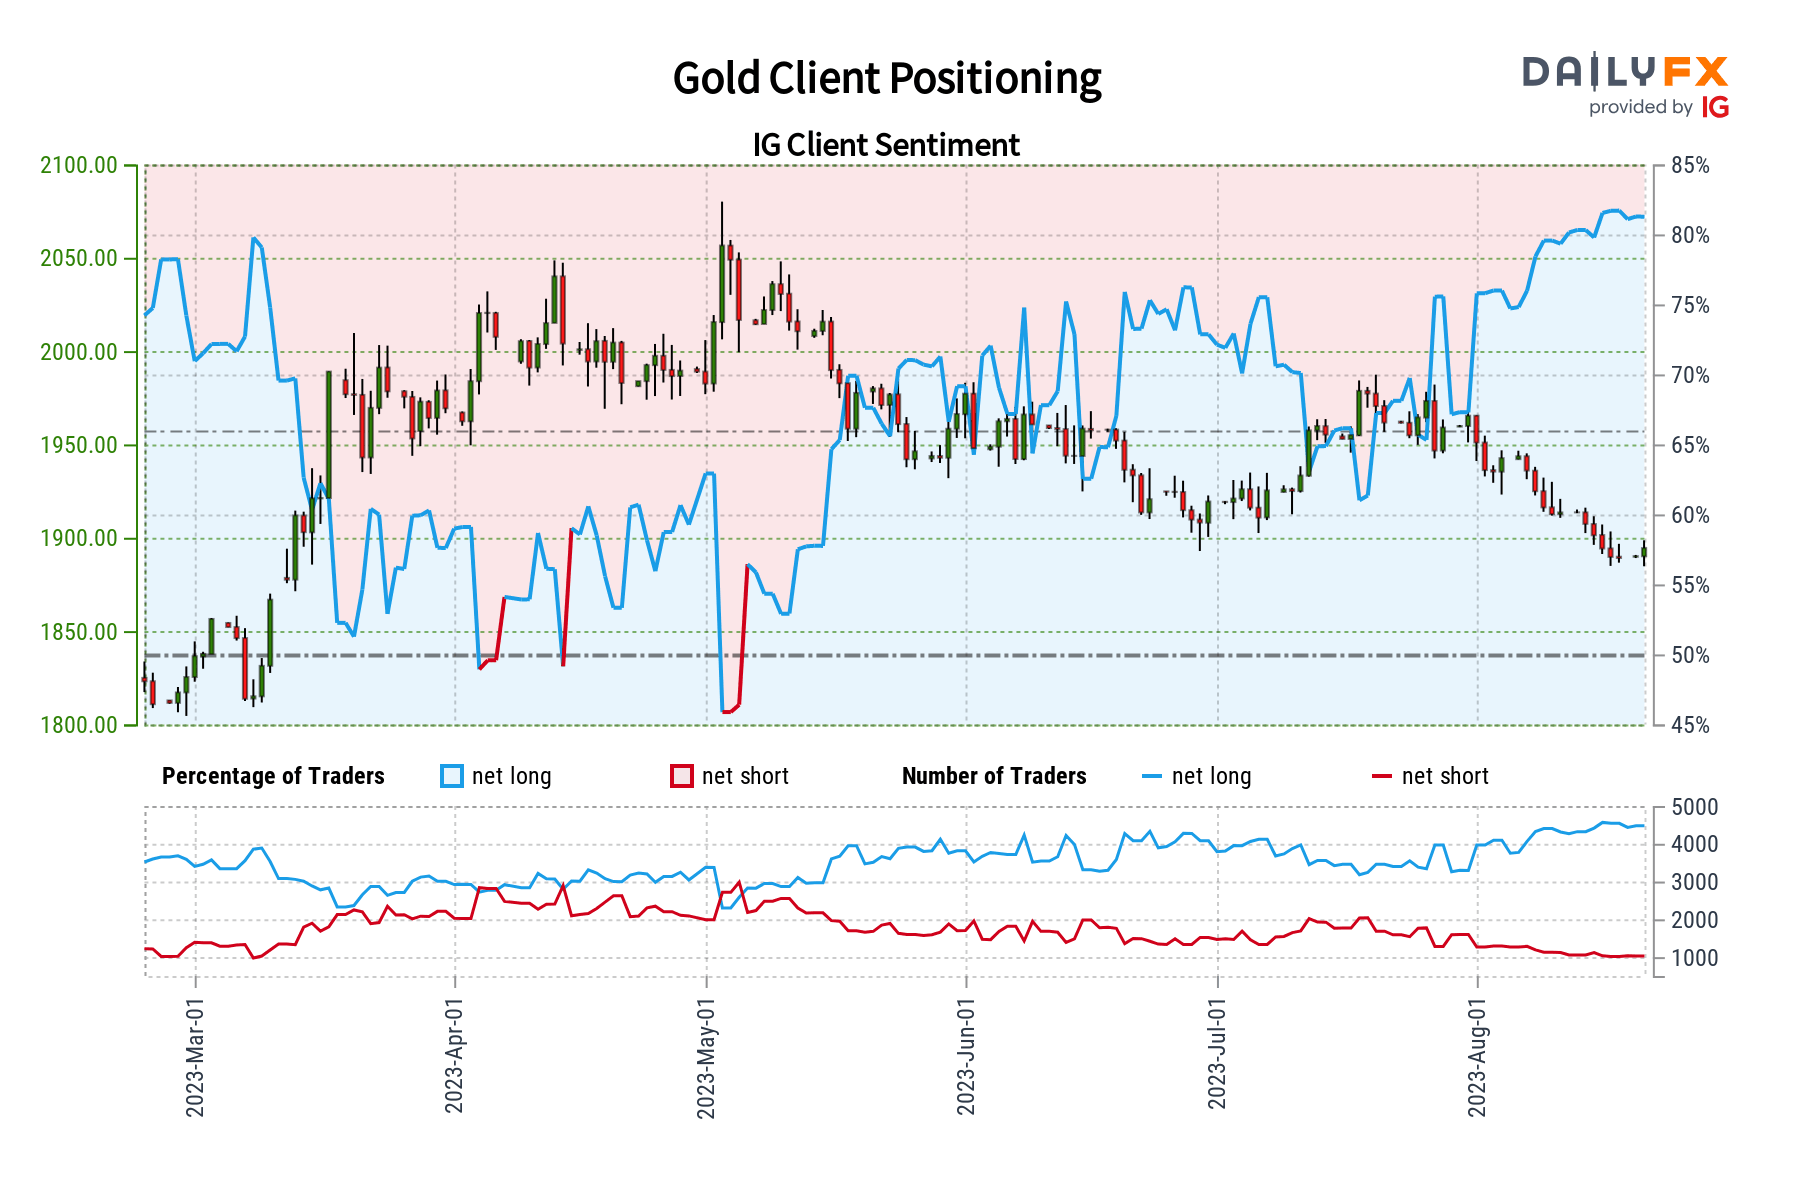
Gold prices concluded a 4th consecutive week of losses this past Friday. In fact, so far this month, the yellow metal is down about 3.6 percent. That marks the worst performance since February. In response, retail traders have become increasingly bullish gold. This can be seen by looking at IG Client Sentiment (IGCS). IGCS tends to function as a contrarian indicator. With that in mind, could further pain be in store for XAU/USD?
Gold Sentiment Outlook – Bearish
The IGCS gauge shows that about 81% of retail traders are net-long gold. Since most of them are biased to the upside, this hints that prices may continue to fall. This is as upside exposure increased by 4.02% and 6.91% compared to yesterday and last week, respectively. With that in mind, this offers a stronger bearish contrarian trading bias for gold.
XAU/USD Daily Chart
Looking at the daily chart, gold continues to make further downside progress under the rising trendline from February, offering an increasingly bearish technical conviction. This is as a falling trendline from April maintains the broader downside focus.
From here, immediate resistance is the 38.2% Fibonacci retracement level of 1903. Pushing above this price may open the door to revisiting the falling trendline, which could reinstate a downside focus.
Otherwise, extending losses places the focus on support which is the midpoint of the Fibonacci retracement at 1848.
Recommended by Daniel Dubrovsky
How to Trade Gold
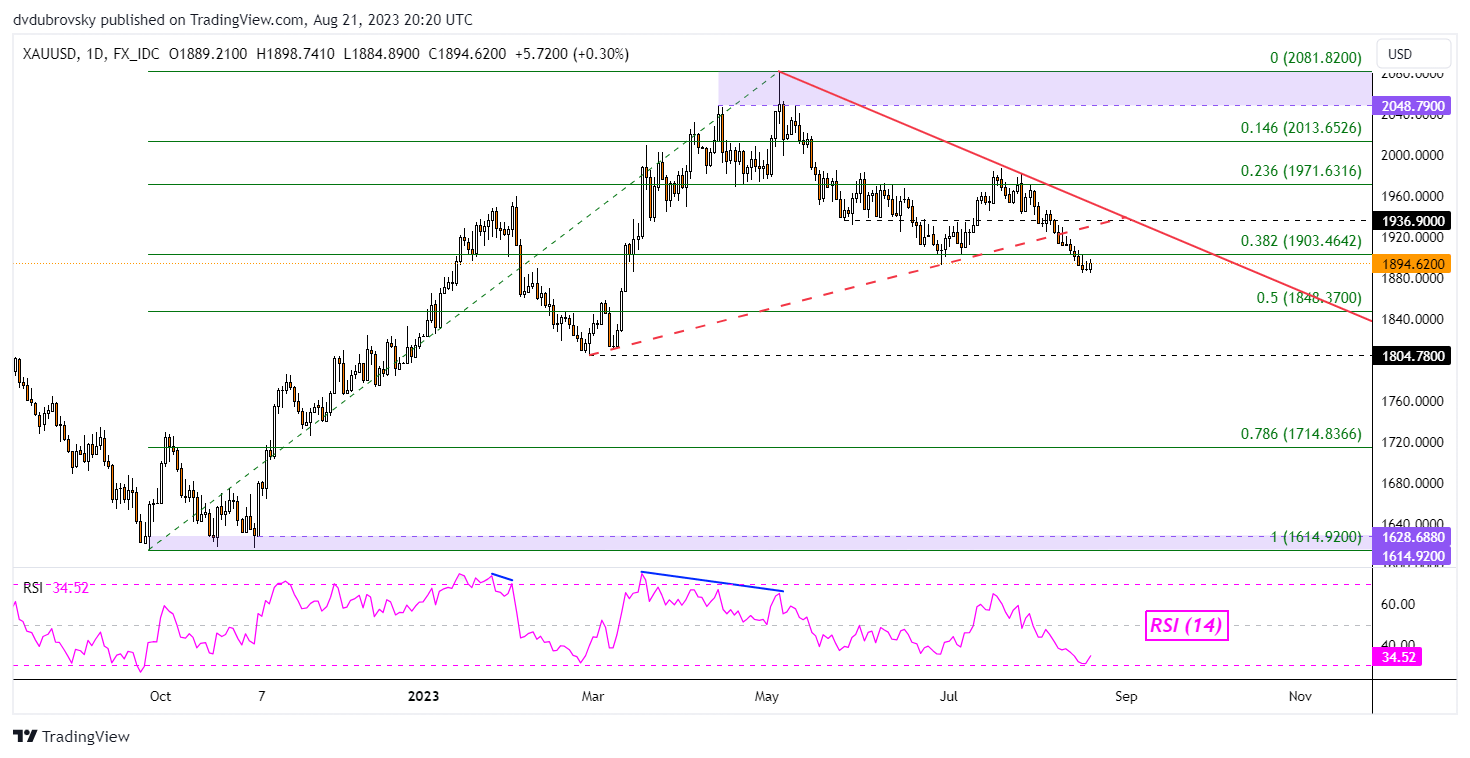
Chart Created in Trading View
— Written by Daniel Dubrovsky, Senior Strategist for DailyFX.com

 آموزش مجازی مدیریت عالی و حرفه ای کسب و کار DBA


ارسال نظر شما
مجموع نظرات : 0 در انتظار بررسی : 0 انتشار یافته : 0