Gold, Silver Analysis
- Gold eases after last week’s advance – quieter week on the economic calendar
- FOMC minutes and reports of a new phase in the Israel-Hamas war present potential catalysts
- Silver encounters a challenge at channel resistance
- The analysis in this article makes use of chart patterns and key support and resistance levels. For more information visit our comprehensive education library
Gold Eases After Last Week’s Advance
Gold rose last week to end a two-week run of losses but Friday’s price action laid the ground for a potential move lover this week. Friday’s extended upper wick revealed the early sign of a possible pullback developing at the start of this week.
Price action now heads lower, trading down from the $1985 level, with he $1937 level next in view – as support. The $1937 level is significant as it roughly coincides with the 200-day simple moving average (SMA).
In recent trading days, a weaker dollar and easing US yields (Treasuries) have helped prop up gold prices after hitting a low on November 13th – the day before that softer US CPI print that inspired a dollar selloff.
The FOMC minutes offer up a potential catalyst for the precious metal this week as far as it affects the dollar. Other than that it is a relatively quiet week however, a new phase in the Israel-Hamas war could see gold find it feet once more.
Gold (XAU/USD) Daily Chart
Source: TradingView, prepared by Richard Snow
Recommended by Richard Snow
How to Trade Gold
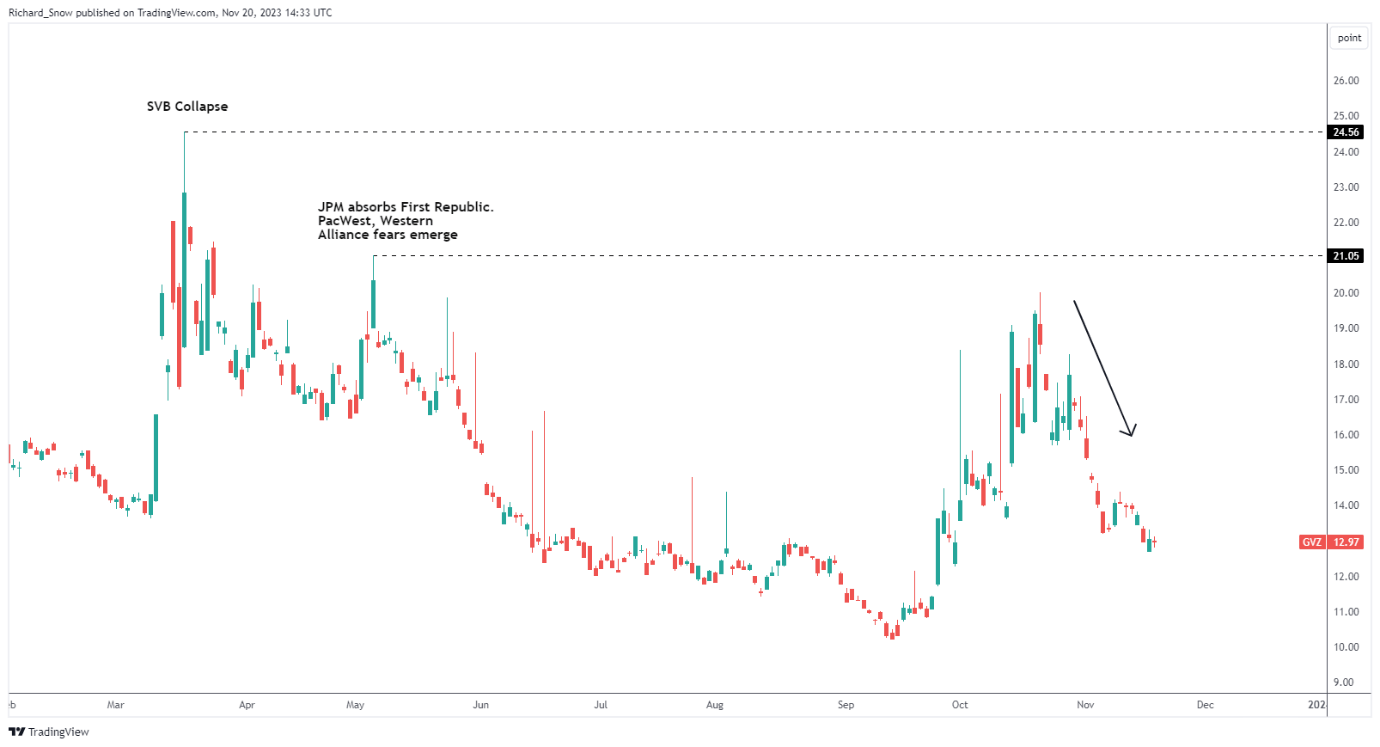
Expected 30-day gold volatility continues to drop off a cliff after a brief period of consolidation. The longer this trend continues gold is unlikely to spike higher like we saw at the start of the conflict, but the metal is still in a favourable position to capitalize on further USD selling and lower US yields.

30-Day Expected Gold Volatility (GVZ) Source: TradingView, prepared by Richard Snow
Silver Encounters a Challenge at Channel Resistance
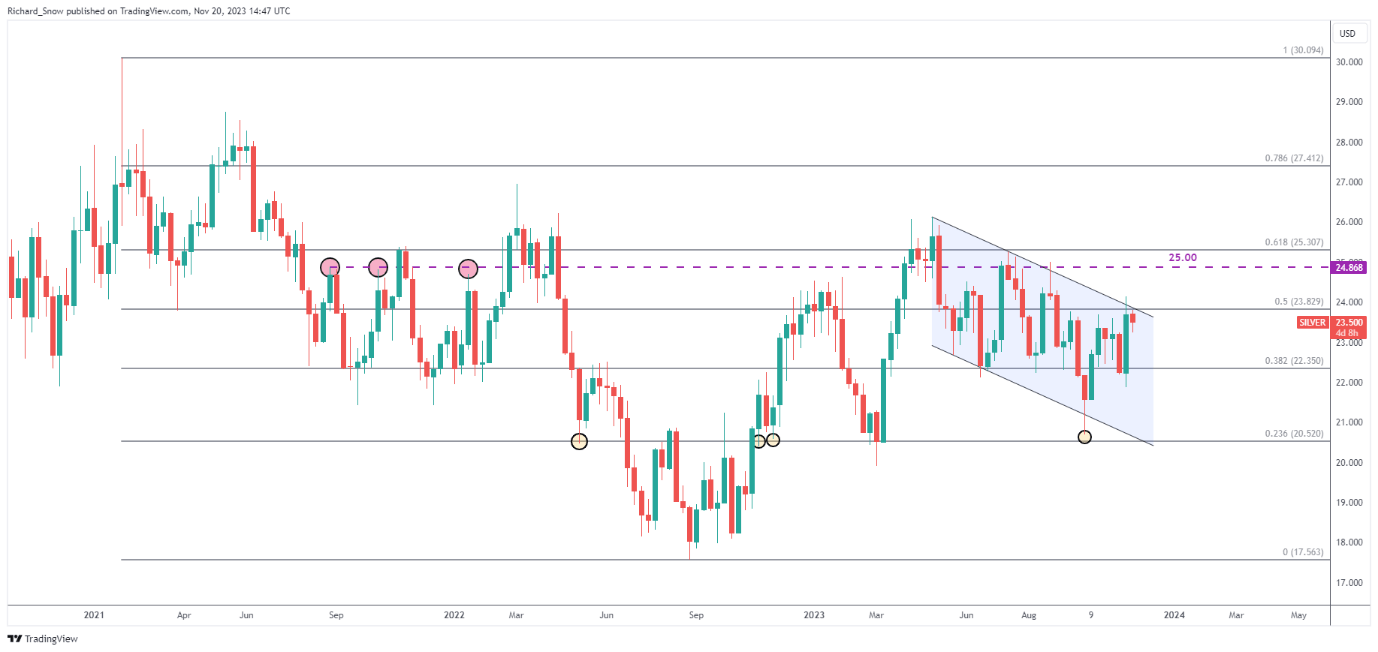
Silver also posted an impressive week last week, rising up to channel resistance and the (less significant) 50% Fibonacci retracement. Nevertheless, the metal has started the week on the back foot, with a continued drop opening up $22.35 (38.2% Fib) as a possible level of support. A larger move sees channel support come into play at the 23.6% fib retracement , $20.52.
Silver (XAG/USD) Weekly Chart

Source: TradingView, prepared by Richard Snow
Trade Smarter – Sign up for the DailyFX Newsletter
Receive timely and compelling market commentary from the DailyFX team
Subscribe to Newsletter
— Written by Richard Snow for DailyFX.com
Contact and follow Richard on Twitter: @RichardSnowFX


 آموزش مجازی مدیریت عالی و حرفه ای کسب و کار DBA


ارسال نظر شما
مجموع نظرات : 0 در انتظار بررسی : 0 انتشار یافته : ۰