

Gold, Retail Trader Positioning, Technical Analysis – IGCS Update
- Gold prices surge higher on JOLTS job openings
- Retail traders continued increasing bearish bets
- XAU/USD may rise, but faces key resistance now
Recommended by Daniel Dubrovsky
Get Your Free Gold Forecast
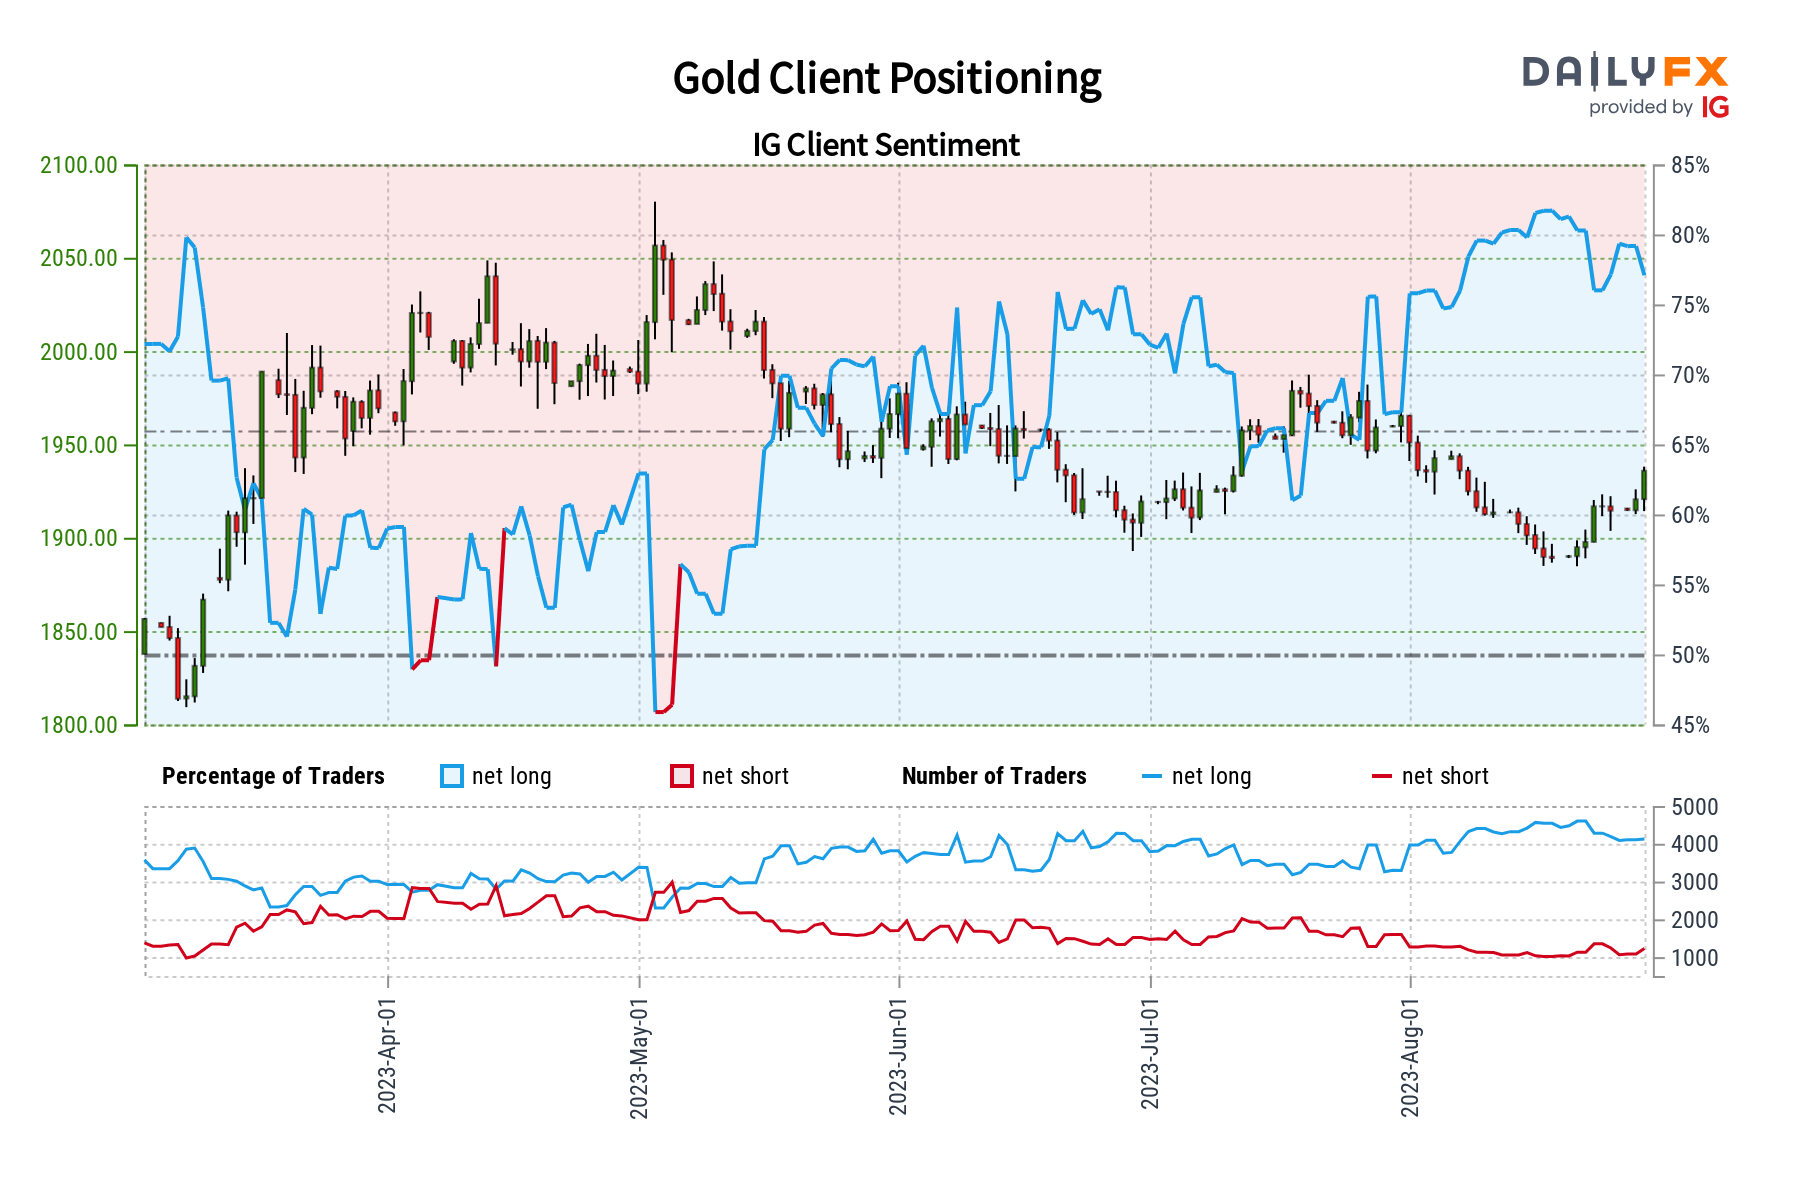
Gold prices soared nearly 1% over the past 24 hours after an unexpected miss in US job openings increased expectations of a more dovish Federal Reserve in the long run. Retail traders have responded immediately, increasing bearish XAU/USD exposure. This can be seen by looking at IG Client Sentiment (IGCS), which often functions as a contrarian indicator. With that in mind, will gold make further upside progress?
Gold Sentiment Outlook – Bullish
The IGCS gauge shows that about 71% of retail traders are net-long gold. Since most are still biased to the upside, this suggests prices may fall down the road. But, downside exposure has increased by 16.35% and 45.24% compared to yesterday and last week, respectively. With that in mind, recent changes in exposure warn that the current price trend may extend higher.
| Change in | Longs | Shorts | OI |
| Daily | -12% | 37% | -1% |
| Weekly | -23% | 60% | -8% |
XAU/USD Daily Chart
Recent gains in gold prices have pushed the yellow metal back to the key falling trendline from April. It is also sitting on the intersection of a former rising trendline from November. The pink circle in the chart below highlights this potential key zone of resistance that could prove too formidable to break through. But, an upside breakout would offer a stronger bullish technical conviction.
That would place the focus on the 23.6% Fibonacci retracement level of 1971 followed by the minor 14.6% point at 2013.65. Otherwise, holding at resistance and turning lower would be in line with the broader downtrend since earlier this year. Key support is the 38.2% level at 1903.46 followed by the August swing low of 1884.
Recommended by Daniel Dubrovsky
How to Trade Gold
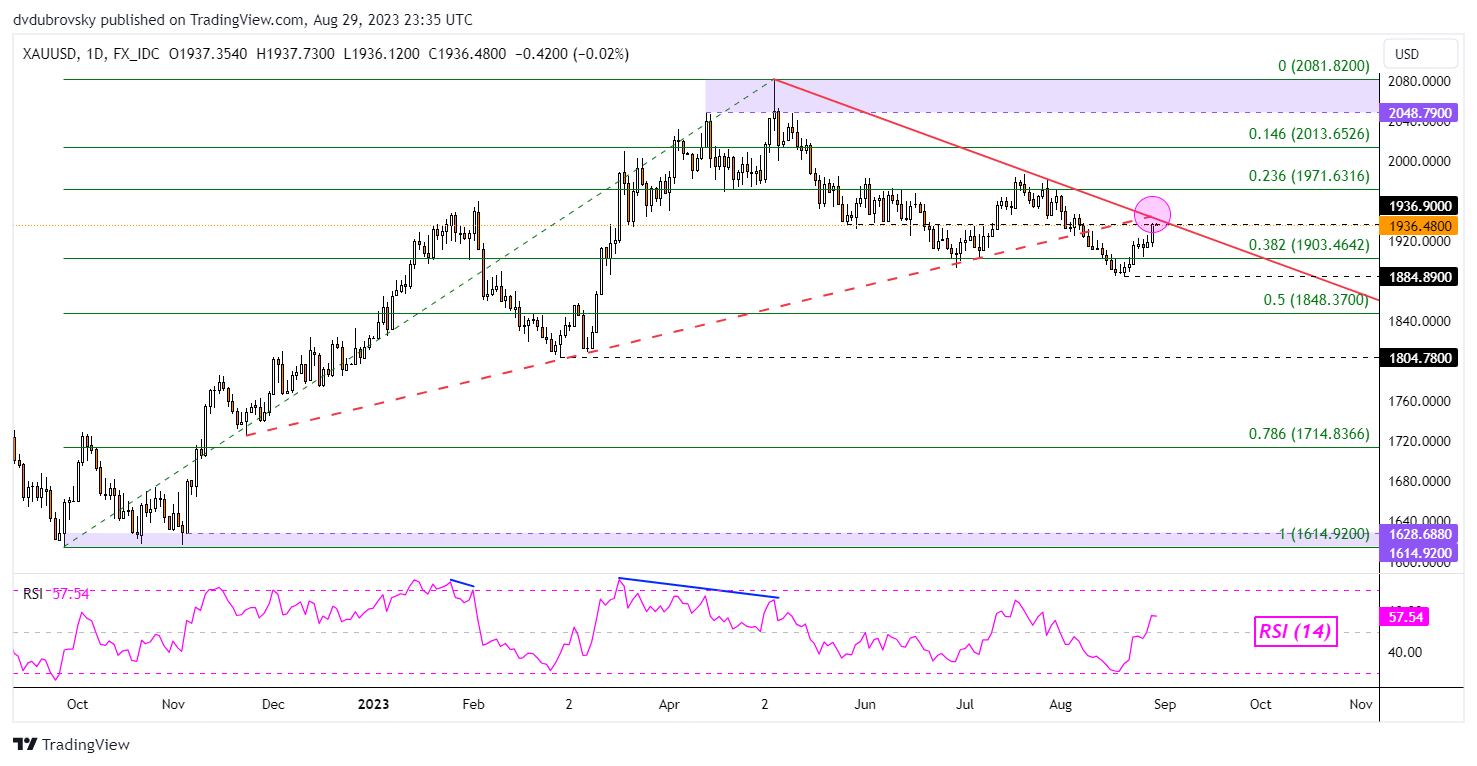
Chart Created in Trading View
— Written by Daniel Dubrovsky, Senior Strategist for DailyFX.com

 آموزش مجازی مدیریت عالی و حرفه ای کسب و کار DBA


ارسال نظر شما
مجموع نظرات : 0 در انتظار بررسی : 0 انتشار یافته : 0