XAG/USD dives as investors digest Powell’s words, US data
[ad_1] Share: The Silver’s spot price XAG/USD is down by more than 1%, around $22.30. Jerome Powell from the Fed was seen as hawkish on Thursday, fuelling US bond yields. Markets are pricing in rates at restrictive levels for a more extended period. UoM Consumer Sentiment data from the US came in lower

[ad_1]
- The Silver’s spot price XAG/USD is down by more than 1%, around $22.30.
- Jerome Powell from the Fed was seen as hawkish on Thursday, fuelling US bond yields.
- Markets are pricing in rates at restrictive levels for a more extended period.
- UoM Consumer Sentiment data from the US came in lower than expected.
At the end of the week, the XAG/USD plunged toward $22.30 and will close a 3% weekly loss, mainly driven by the US Dollar and yields recovering through the week, which pushed the metal’s price downwards.
After the Greenback weakened following the Federal Reserve (Fed) held rates steady last week, which markets interpreted as the bank reaching the end of its cycle and the release of a weak jobs report from October, the USD recovered in the last sessions. This was due to Fed hawks stepping in and Chair Powell claiming that the bank’s job wasn’t done, which fueled a rise in the US bond yields.
In line with that, the Treasury rates, often seen as the cost of holding non-yielding metals, recovered after reaching multi-week lows last week, and on Thursday, they jumped back towards to their highest levels in November, which made holding Silver lose interest.
On the data front, the University of Michigan revealed that the Michigan Consumer Sentiment index from November from the US came in lower than expected at 60.4, vs the consensus of 63.7 and declined from its previous reading of 63.8. As a reaction, the negative figures seem to be limiting the upside for the USD, whose DXY index trades neutral at 105.90.
XAG/USD Levels to watch
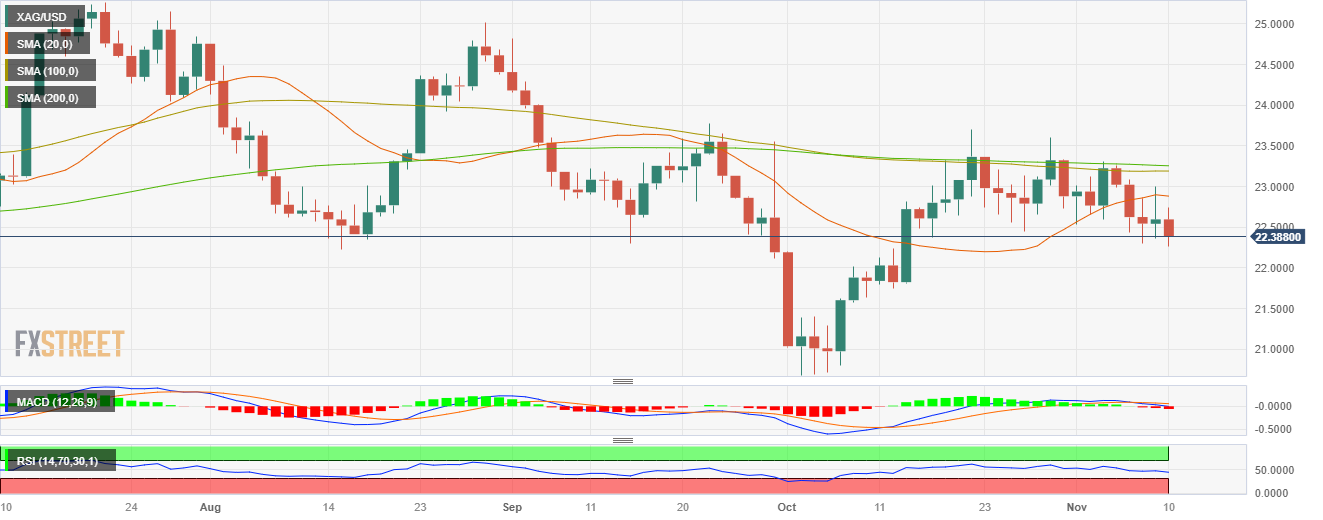
From a technical standpoint, the XAG/USD maintains a bearish outlook for the short term, as observed on the daily chart. The Relative Strength Index (RSI) is comfortably positioned in the negative territory below its midline and has a southward slope, complemented by a negative signal from the Moving Average Convergence Divergence (MACD), which is showing red bars, signalling a growing bearish momentum. On the other hand, the pair is below the 20,100,200-day Simple Moving Average (SMA), implying that the bears retain control on a broader scale.
Resistance levels: $22.90 (20-day SMA), $23.00,$23.30 (100 and 200-day SMA convergence).
Support levels: $22.30, $22.15,$22.00.
XAG/USD Daily Chart

[ad_2]
لینک منبع : هوشمند نیوز
 آموزش مجازی مدیریت عالی حرفه ای کسب و کار Post DBA آموزش مجازی مدیریت عالی حرفه ای کسب و کار Post DBA+ مدرک معتبر قابل ترجمه رسمی با مهر دادگستری و وزارت امور خارجه |  آموزش مجازی مدیریت عالی و حرفه ای کسب و کار DBA آموزش مجازی مدیریت عالی و حرفه ای کسب و کار DBA+ مدرک معتبر قابل ترجمه رسمی با مهر دادگستری و وزارت امور خارجه |  آموزش مجازی مدیریت کسب و کار MBA آموزش مجازی مدیریت کسب و کار MBA+ مدرک معتبر قابل ترجمه رسمی با مهر دادگستری و وزارت امور خارجه |
 مدیریت حرفه ای کافی شاپ |  حقوقدان خبره |  سرآشپز حرفه ای |
 آموزش مجازی تعمیرات موبایل آموزش مجازی تعمیرات موبایل |  آموزش مجازی ICDL مهارت های رایانه کار درجه یک و دو |  آموزش مجازی کارشناس معاملات املاک_ مشاور املاک آموزش مجازی کارشناس معاملات املاک_ مشاور املاک |
- نظرات ارسال شده توسط شما، پس از تایید توسط مدیران سایت منتشر خواهد شد.
- نظراتی که حاوی تهمت یا افترا باشد منتشر نخواهد شد.
- نظراتی که به غیر از زبان فارسی یا غیر مرتبط با خبر باشد منتشر نخواهد شد.


ارسال نظر شما
مجموع نظرات : 0 در انتظار بررسی : 0 انتشار یافته : 0