Japanese Yen (USD/JPY, GBP/JPY) Analysis
Recommended by Richard Snow
How to Trade USD/JPY
BoJ Summary of Opinions Confirm Dovish Yield Curve Tweak
Bank of Japan (BoJ) officials looked to set the record straight, that the slight yield curve adjustment announced on the 28th of July was a means of prolonging current loose monetary policy in a sustainable way. The Bank decided to allow the 10-year Japanese Government Bond yield to trade ‘flexibly’ above 0.5% instead of enforcing this level as a cap.
Global markets anticipated that the slight change was a step towards eventual policy normalization as wages and inflation head higher. BoJ officials are yet to be convinced that the uptick in inflation is demand driven and likely to continue above 2% in a sustainable manner. As such, it would appear there is still some way to go before the Bank will be convinced to change course.
USD/JPY: Broad USD Uptrend Buoyed by Rising 10-Year Yields
The dollar appears to be clawing back losses that developed at the end of last week. Bullish momentum in the 10-year US treasury yield bodes well for the currency despite Friday’s pullback which wasn’t enough to wipe out the larger move. US CPI later this week should keep traders in their toes as a slight pick up in headline inflation is anticipated with a minor move lower forecasted for core inflation.
142.25 is the most immediate line of resistance, providing a tripwire for bullish continuation. Thereafter, the June swing high of 145 comes into view. On the short side, 138.20 – which is the level around the December yield curve announcement – appears as support, with 134.5 some distance away.
USD/JPY Daily Chart
Source: TradingView, prepared by Richard Snow
GBP/JPY: Bullish Momentum Stalls Near Swing High
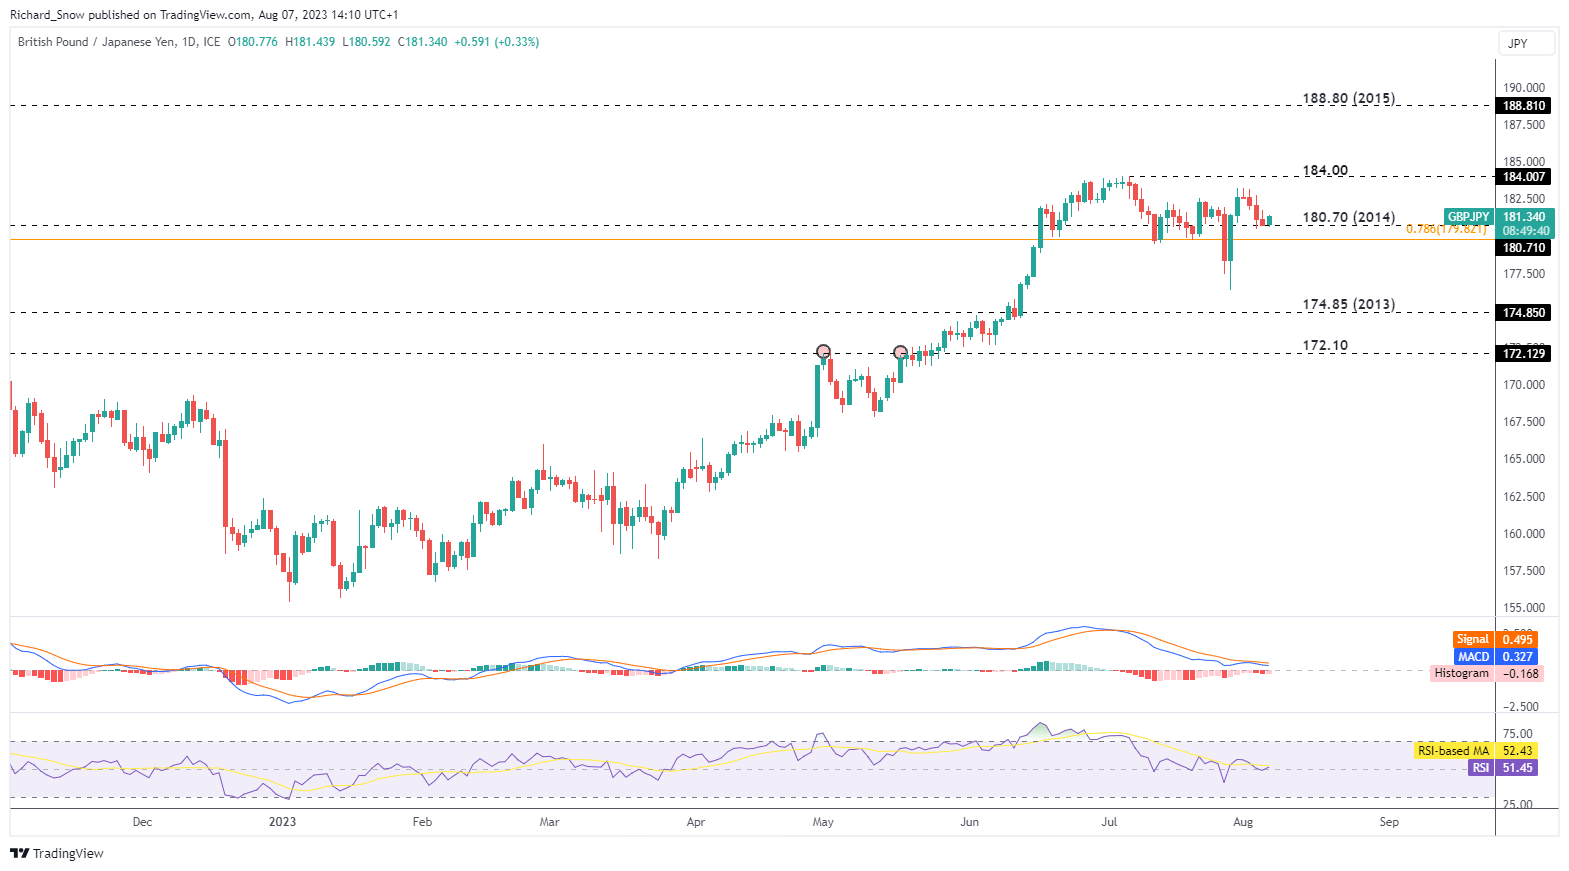
The pound has struggled for momentum across G7 FX pairs after recording its first significant drop in core inflation in early July. Looking at the GBP/JPY pair, the period of broader consolidation has ensued since mid-June – with prices trading more or less inside the 179.82 – 184 levels if the sharp drop and immediate recovery around the 28 July BoJ meeting is put to the side.
More recent price action appears to reveal a bounce off the 2014 long-term level of 180.70. A drift higher towards 184 cannot be discounted, while the 78.6% Fibonacci retracement of the 2015 – 2016 move at 179.82 acts as the tripwire for a move lower with 174.85 as the next level of support.
GBP/JPY Daily Chart

Source: TradingView, prepared by Richard Snow
Trade Smarter – Sign up for the DailyFX Newsletter
Receive timely and compelling market commentary from the DailyFX team
Subscribe to Newsletter
— Written by Richard Snow for DailyFX.com
Contact and follow Richard on Twitter: @RichardSnowFX


 آموزش مجازی مدیریت عالی و حرفه ای کسب و کار DBA


ارسال نظر شما
مجموع نظرات : 0 در انتظار بررسی : 0 انتشار یافته : ۰