

Japanese Yen, USD/JPY, EUR/JPY – Technical Update:
- Will the Japanese Yen hold its ground at resistance?
- USD/JPY is struggling as momentum is fading
- EUR/JPY eyeing imminent Rising Wedge breakout
Recommended by Daniel Dubrovsky
Get Your Free JPY Forecast
The US Dollar continues struggling to make further upside progress against the Japanese Yen. Resistance has been firmly reinforced around 146.56 over the course of August. Now, negative RSI divergence shows that upside momentum is increasingly fading. This can at times precede a turn lower, opening the door to a drop to the 20-day Moving Average (MA).
Breaking under the latter could open the door to a near-term bearish technical bias. But, the broader uptrend is being upheld by rising support from March. Still, getting there entails clearing past the 141.95 inflection point. Otherwise, extending higher from here and clearing 146.56 exposes the 61.8% Fibonacci extension level of 148.27.
Recommended by Daniel Dubrovsky
How to Trade USD/JPY
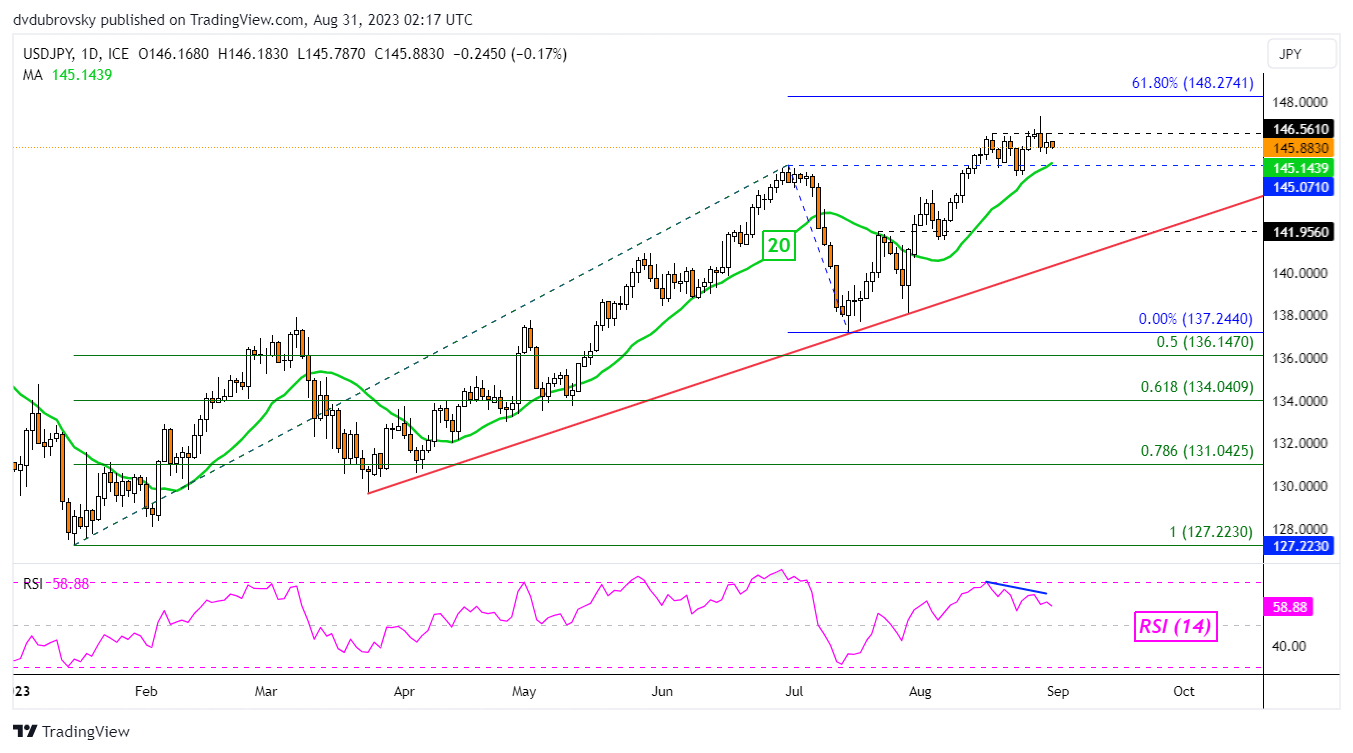
Chart Created in TradingView
Meanwhile, the Euro is showing more aggression against the Japanese Yen. But, here too are a couple of bearish warning signs. EUR/JPY is trading within the boundaries of a Rising Wedge chart formation. This is typically a bearish pattern. A breakout lower could open the door to an extended reversal. That would place the focus on the 50-day Moving Average.
Whichever the direction, a breakout looks imminent om the next 24 – 48 hours. Clearing lower and the 50-day MA places the focus on the 23.6% Fibonacci retracement level of 153.47, followed by the July low of 151.41. Otherwise, pushing higher places the focus on the midpoint of the Fibonacci extension at 161.
| Change in | Longs | Shorts | OI |
| Daily | -5% | 8% | 5% |
| Weekly | 2% | 16% | 13% |
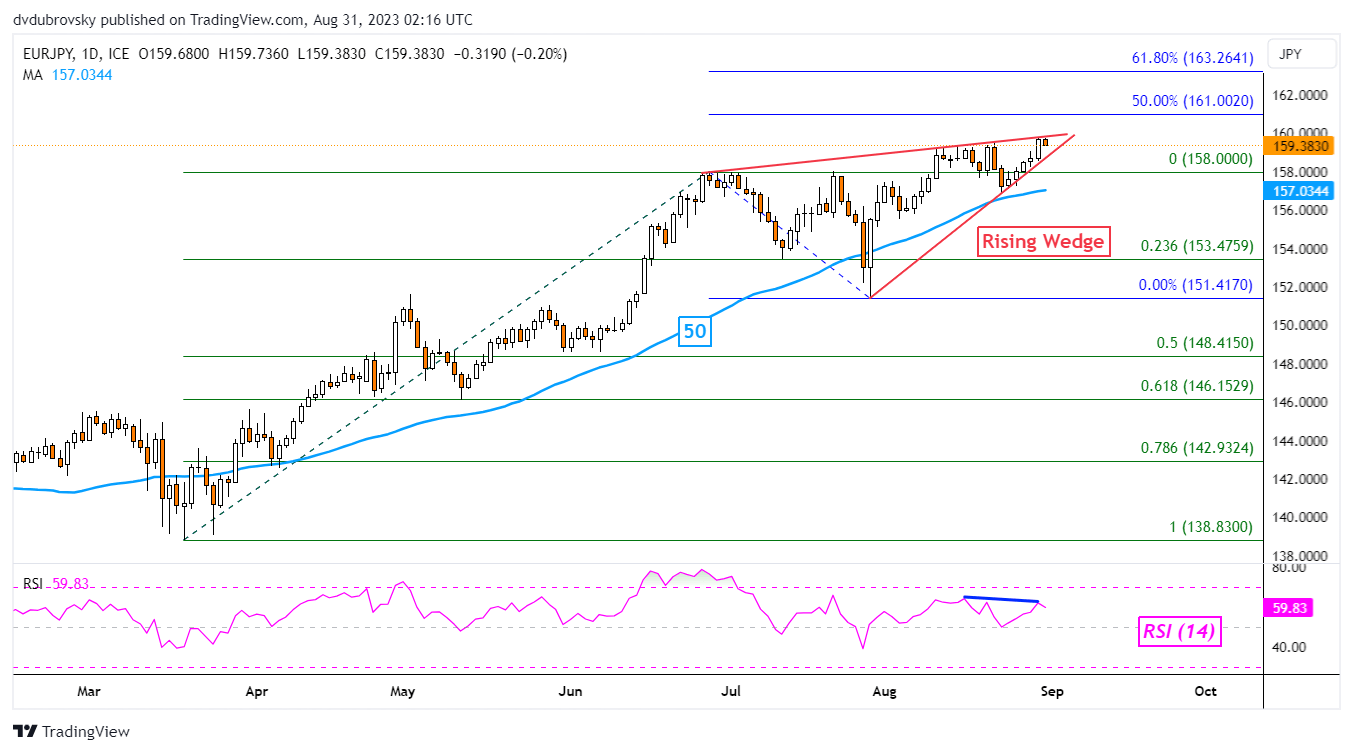
Chart Created in TradingView
— Written by Daniel Dubrovsky, Senior Strategist for DailyFX.com

 آموزش مجازی مدیریت عالی و حرفه ای کسب و کار DBA


ارسال نظر شما
مجموع نظرات : 0 در انتظار بررسی : 0 انتشار یافته : 0