USD/JPY Flat, AUD/USD Dives after Rejection, USD/MXN Soars
The U.S. dollar traded higher against most peers on Wednesday amid risk-off sentiment. Compared to the Japanese yen, however, the greenback was largely flat, with USD/JPY fluctuating around the 149.75 level at the time of writing. The ongoing geopolitical conflict in the Middle East, stemming from Hamas attacks in Israel, continued to shape market dynamics,

The U.S. dollar traded higher against most peers on Wednesday amid risk-off sentiment. Compared to the Japanese yen, however, the greenback was largely flat, with USD/JPY fluctuating around the 149.75 level at the time of writing. The ongoing geopolitical conflict in the Middle East, stemming from Hamas attacks in Israel, continued to shape market dynamics, forging a challenging environment for riskier currencies. This article provides an in-depth analysis of where the prices of USD/JPY, AUD/USD, and USD/MXN may be headed.
Most Read: Australian Dollar Present Bearish Backdrop. What Now for AUD/USD
USD/JPY ANALYSIS
USD/JPY traded around the flat line on Wednesday. Rising U.S. Treasury yields provided support for the U.S. dollar, but the yen saw stronger demand from escalating geopolitical tensions in the Middle East, creating a neutral backdrop for the exchange rate. While both the yen and the U.S. dollar tend to be perceived as safe-haven assets, the yen is typically the more favored choice in times of heightened market uncertainty.
In terms of technical analysis, USD/JPY remains entrenched within a solid uptrend. However, caution is warranted given the pair’s proximity to the 150.00 level, a threshold that when breached has been associated with Japanese government actions to defend the country’s currency against further depreciation.
If Tokyo refrains from intervention and allows the exchange rate to drift above the psychological 150.00 level in a decisive fashion, upward impetus could gather pace, setting the stage for a rally towards the 2022 highs at 151.95. On further strength, the bulls could launch an assault on channel resistance in the 152.25 area.
In the event that prices face rejection and initiate a descent, initial support extends from 149.25 to 148.90. Successfully breaking through this floor could attract new sellers into the market, creating the right conditions for a possible pullback towards 147.30. Looking further down the line, the next area of interest is situated around the 146.00 handle.
For a comprehensive view of the Japanese yen’s fundamental and technical outlook, make sure to download our Q4 trading forecast today. It is totally free!
Recommended by Diego Colman
Get Your Free JPY Forecast
USD/JPY TECHNICAL CHART
USD/JPY Chart Created Using TradingView
AUD/USD ANALYSIS
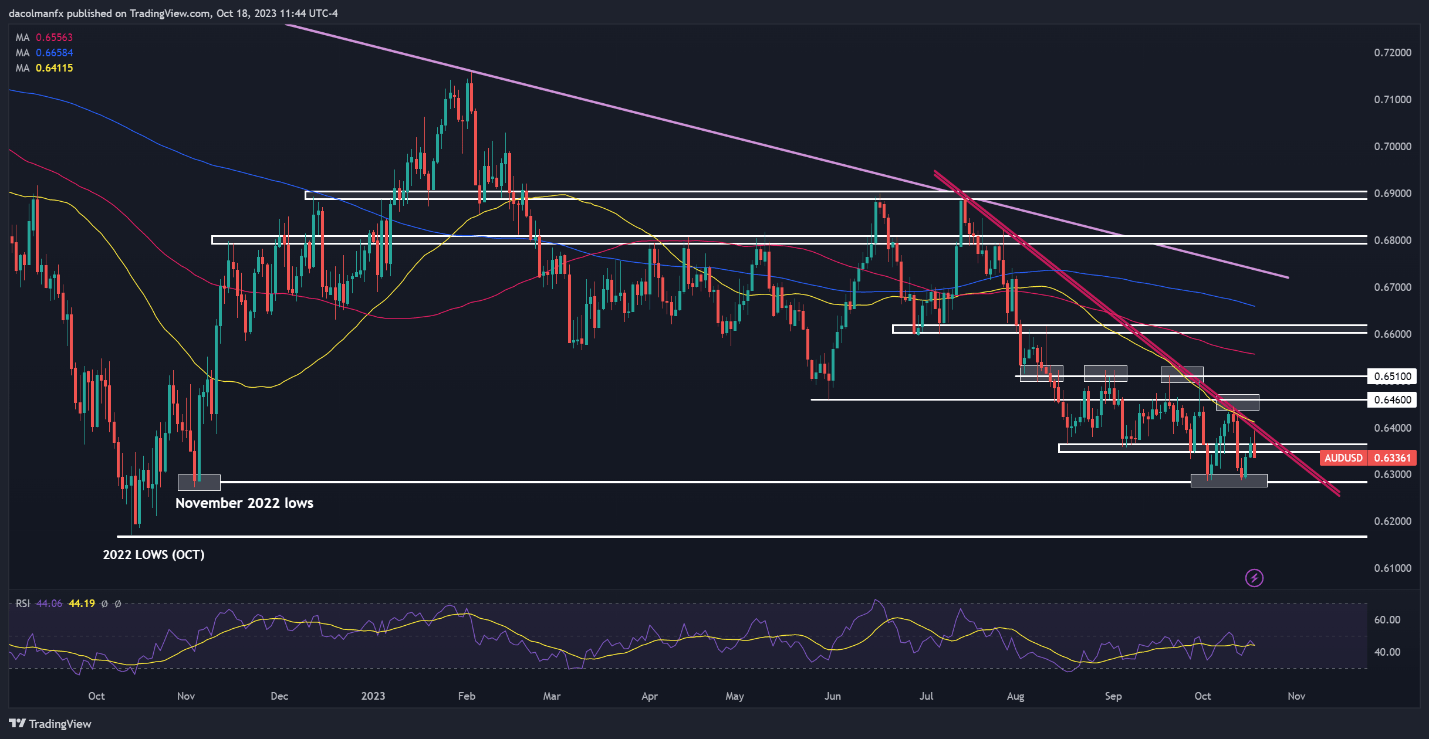
AUD/USD rebounded from support earlier in the week, but its recovery stalled when prices hit trendline resistance in the 0.6400 area during the overnight session. At that point, sellers resurfaced, triggering a meaningful pullback, which was later aggravated by the surge in U.S. Treasury yields. For context, the US 10-year bond soared past the 4.9% threshold on Wednesday, reaching its highest reading since 2007.
With sellers seemingly back at the steering wheel and sentiment deteriorating by the minute on escalating geopolitical tensions, the pair could head towards its 2023 lows in the near term. While prices could find a foothold in this zone on a retest, a breakdown could strengthen bearish momentum, paving the way for a drop towards last year’s lows at 0.6170.
Conversely, if buyers stage a comeback and trigger a bullish turnaround, the first ceiling to consider appears to be located at 0.6350. Upside clearance of this barrier could expose dynamic trendline resistance near the 0.6400 mark at the time of writing. On further strength, we could observe a climb towards 0.6460, followed by 0.6510.
Looking for informative insights into where the Australian Dollar is headed and the crucial market catalysts to keep on your radar? Explore the answers in our Q4 trading guide. Grab a copy today!
Recommended by Diego Colman
Get Your Free AUD Forecast
AUD/USD TECHNICAL CHART

AUD/USD Chart Created Using TradingView
If you’re puzzled by trading losses, why not take a step in the right direction? Download our guide, “Traits of Successful Traders,” and gain valuable insights to steer clear of common pitfalls that can lead to costly errors.
Recommended by Diego Colman
Traits of Successful Traders
USD/MXN ANALYSIS
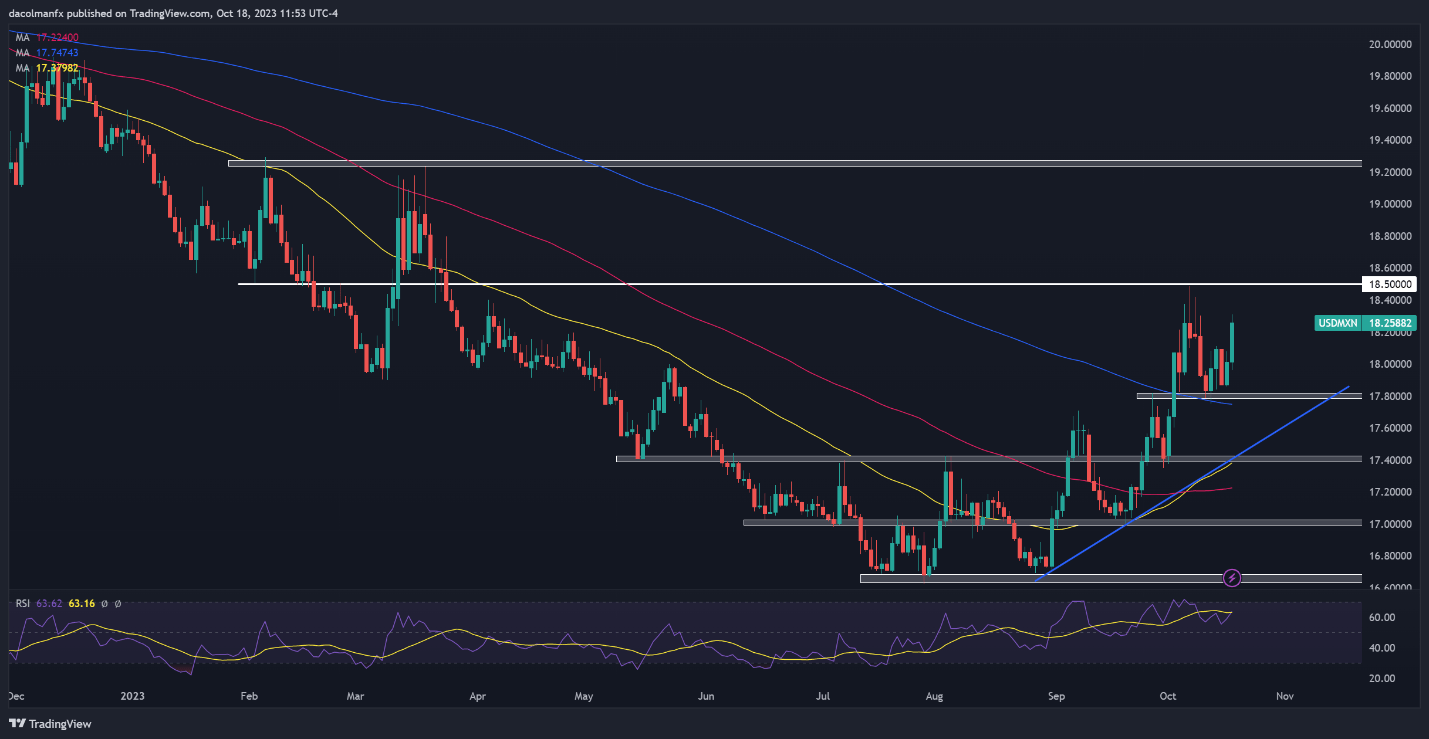
The Mexican peso sold off on Wednesday, weighed by negative sentiment and EMFX weakness. In this context, USD/MXN advanced more than 1.3% in early afternoon trading in New York, gaining ground for the second straight day. If the mood continues to sour in global markets, the pair is likely to retain a bullish bias and possibly challenge resistance at 18.50. In case of continued strength, attention shifts to 19.25.
Conversely, if USD/MXN resumes its long-term decline, initial support rests at 17.80, but further losses may be in a store on a push below this area, with the next floor located at 17.43.
USD/MXN TECHNICAL CHART

USD/MXN Chart Created Using TradingView
 آموزش مجازی مدیریت عالی حرفه ای کسب و کار Post DBA آموزش مجازی مدیریت عالی حرفه ای کسب و کار Post DBA+ مدرک معتبر قابل ترجمه رسمی با مهر دادگستری و وزارت امور خارجه |  آموزش مجازی مدیریت عالی و حرفه ای کسب و کار DBA آموزش مجازی مدیریت عالی و حرفه ای کسب و کار DBA+ مدرک معتبر قابل ترجمه رسمی با مهر دادگستری و وزارت امور خارجه |  آموزش مجازی مدیریت کسب و کار MBA آموزش مجازی مدیریت کسب و کار MBA+ مدرک معتبر قابل ترجمه رسمی با مهر دادگستری و وزارت امور خارجه |
 مدیریت حرفه ای کافی شاپ |  حقوقدان خبره |  سرآشپز حرفه ای |
 آموزش مجازی تعمیرات موبایل آموزش مجازی تعمیرات موبایل |  آموزش مجازی ICDL مهارت های رایانه کار درجه یک و دو |  آموزش مجازی کارشناس معاملات املاک_ مشاور املاک آموزش مجازی کارشناس معاملات املاک_ مشاور املاک |
- نظرات ارسال شده توسط شما، پس از تایید توسط مدیران سایت منتشر خواهد شد.
- نظراتی که حاوی تهمت یا افترا باشد منتشر نخواهد شد.
- نظراتی که به غیر از زبان فارسی یا غیر مرتبط با خبر باشد منتشر نخواهد شد.


ارسال نظر شما
مجموع نظرات : 0 در انتظار بررسی : 0 انتشار یافته : ۰