CANADIAN DOLLAR PRICE, CHARTS AND ANALYSIS:
- The Loonie Finally Catches a Break and Could be in For Some Gains Against the Greenback.
- BoC Could Have a Rethink Regarding the Rate Hike Path, Market Participants Pricing in a 35% Chance of a Hike Up From 22%.
- US FOMC Minutes Could Re-Ignite the Dollar Spark, Which Could Push USD/CAD Higher Once More.
- To Learn More About Price Action,Chart PatternsandMoving Averages, Check out theDailyFX Education Series.
Get Your Top Trade Opportunities for Q3 from the DailyFX Team Below
Recommended by Zain Vawda
Get Your Free Top Trading Opportunities Forecast
Read More: The Bank of Canada: A Trader’s Guide
CANADIAN DOLLAR BACKDROP
It has been an interesting couple of weeks for USDCAD with Dollar strength dragging the pair close to the 1.3000 handle. Since however, we have had two bullish weeks and a 400-pip rally to the upside to trade around the 1.3475 handle at the time of writing.
READ MORE: Finance Minister Suzuki Sticks to Script as EUR/JPY, USD/JPY Advance
Canadian inflation today was eyed as a potential catalyst for the CAD bulls to make a return and the inflation print didn’t disappoint. Inflation came in hotter than expected both on a MoM figure as well as the YoY print even though the core inflation number was in line with forecasts.
For all market-moving economic releases and events, see the DailyFX Calendar
Energy prices fell less (-8.2% vs -14.6%) mainly due to gasoline (-12.9% vs -21.6% in June) due to a base-year effect. Also, electricity prices rose faster (11.7% vs 5.8%). The mortgage interest cost index (+30.6%) posted another record year-over-year gain and remained the largest contributor to headline inflation. In a positive for consumers there was a drop in food prices which will no doubt be a relief as we are seeing sticky food prices in other developed markets as well.
Trade Smarter – Sign up for the DailyFX Newsletter
Receive timely and compelling market commentary from the DailyFX team
Subscribe to Newsletter
ECONOMIC CALENDAR AND EVENT RISK AHEAD
US retail sales data also surprised on the upside and did dampen the initial reaction to the Canadian inflation print. We do also have some Fed speakers ahead later in the session which could add further volatility and might spur on the Dollar once more.
Tomorrow of course brings the US FOMC minutes as well which could give us a clear picture as to where Fed members stand in regard to rate hikes moving forward.

For all market-moving economic releases and events, see the DailyFX Calendar
PRICE ACTION AND POTENTIAL SETUPS
USDCAD
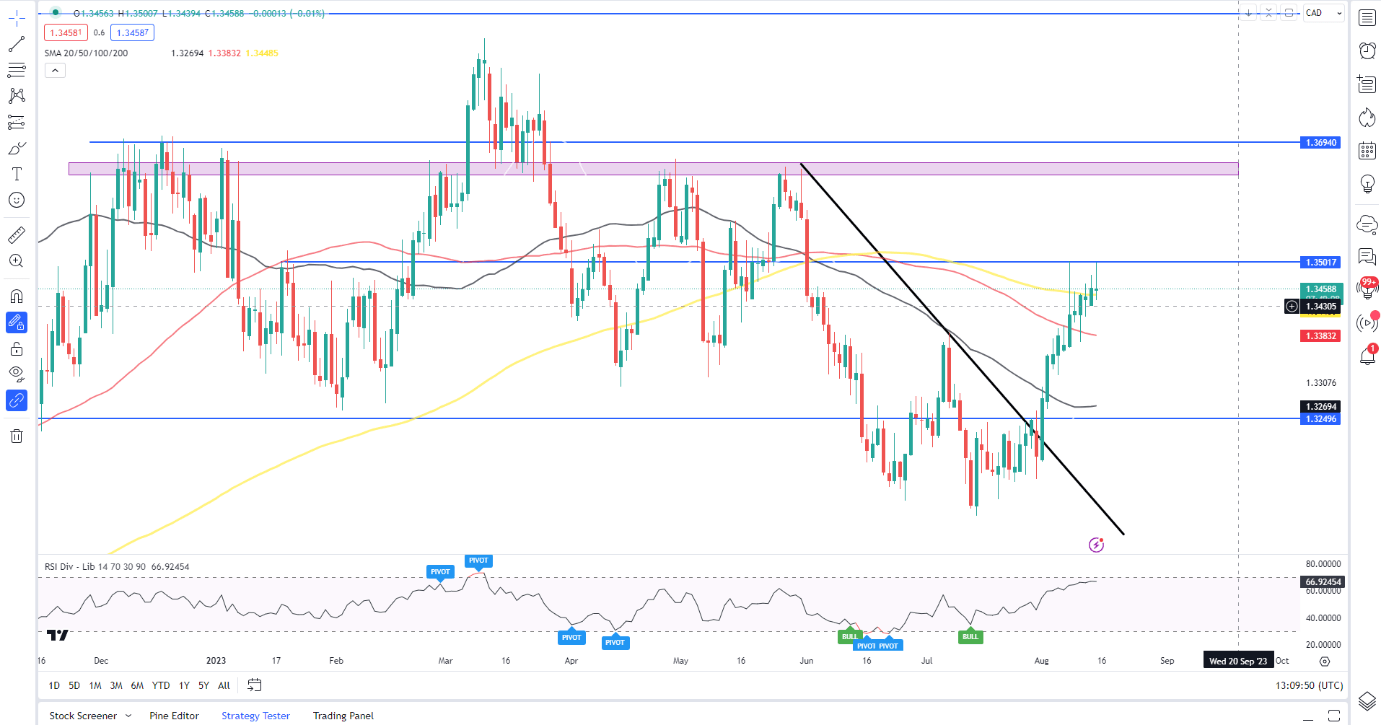
USDCAD has rallied with conviction from recent lows to post two successive weeks of gains and eyeing a third. USDCAD has a tendency to trend for quite some time before reversing but usually puts in significant moves when it does. The pair has already risen +-400 pips from the lows with a break above the 1.3500 handle likely to see one more push toward resistance at around 1.3647. The pair is however entering overbought territory and could spike higher before a selloff.
The Inflation data has seen the pair pullback slightly toward the 1.3450 mark and I will be keeping a close eye on developments around the Dollar Index as well. This could be the beginning of a new leg to the downside but a lot of that may rest on the Dollar Index and its next move We have seen a lot of whipsaw price action post data releases of late and if this continues the CAD could surrender gains as we head deeper into the US session.
USD/CAD Daily Chart

Source: TradingView, prepared by Zain Vawda
Key Levels to Keep an Eye On:
Support levels:
- 1.3450 (200-day MA)
- 1.3385
- 1.3270 (50-day MA)
Resistance levels:
Taking a look at the IG client sentiment data and we can see that retail traders are currently net SHORT with 62% of Traders holding short positions.
For Full Breakdown of the Daily and Weekly Changes in Client Sentiment as well Tips on How to use it, Get Your Free Guide Below
| Change in | Longs | Shorts | OI |
| Daily | -4% | 0% | -2% |
| Weekly | 3% | -12% | -7% |
— Written by Zain Vawda for DailyFX.com
Contact and follow Zain on Twitter: @zvawda


 آموزش مجازی مدیریت عالی و حرفه ای کسب و کار DBA


ارسال نظر شما
مجموع نظرات : 0 در انتظار بررسی : 0 انتشار یافته : ۰