US Stocks Ease Ahead of FOMC Despite Positive Earnings
S&P 500, Nasdaq Analysis Recommended by Richard Snow Get Your Free Equities Forecast Markets Brace for the Fed’s Rate Decision Market participants eagerly await the FOMC statement and press conference where we will hear form Jerome Powell as he answers questions around the terminal rate and whether or not we’ll see further hikes from here?

S&P 500, Nasdaq Analysis
Recommended by Richard Snow
Get Your Free Equities Forecast
Markets Brace for the Fed’s Rate Decision
Market participants eagerly await the FOMC statement and press conference where we will hear form Jerome Powell as he answers questions around the terminal rate and whether or not we’ll see further hikes from here?
The most likely answer will be to revert to data dependence and downplay the significance of two encouraging core CPI prints for May and June respectively. Such an approach provides the committee with maximum flexibility until such time as they can conclude that monetary policy is sufficiently restrictive to see a return to 2% inflation. Such an outcome could see markets lift the probability of another 25-basis point hike (25-bps hike is assumed for the 26 July meeting) anytime between September and December – supporting the dollar and possibly weighing on recent equity gains.
Customize and filter live economic data via our DailyFX economic calendar
S&P 500 Expected to Open Lower Despite Solid Earnings Updates
S&P 500 futures point towards a softer open this morning as traders prepare for the FOMC decision at 7pm UK time. This is despite better-than-expected earnings per share (EPS) for both Alphabet (Google) and Microsoft – two of the three largest stocks in the index by market cap.
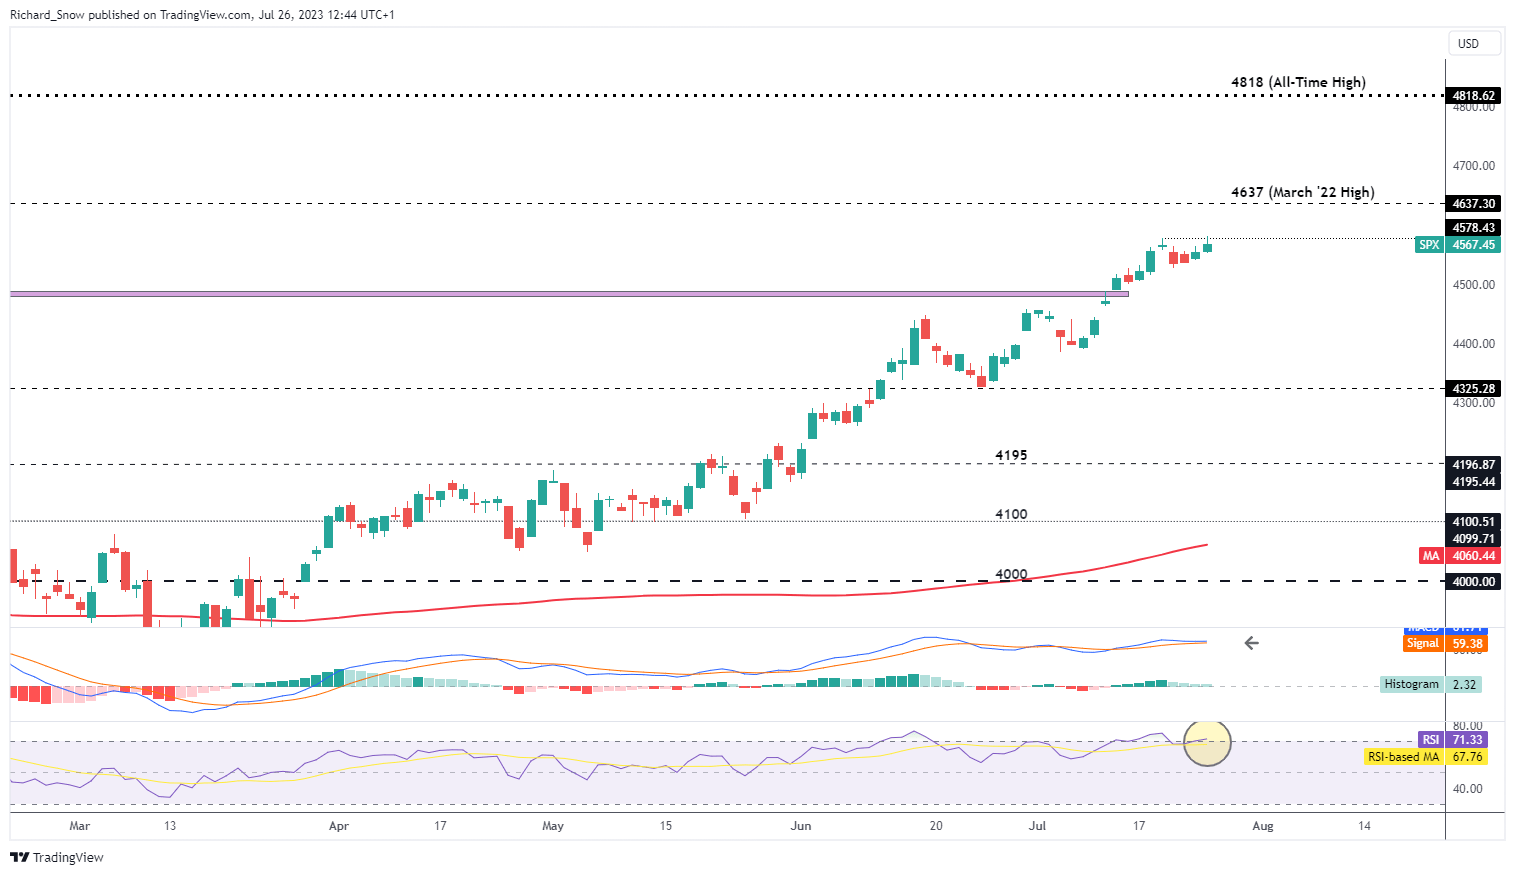
Given the reluctance to trade higher, could this finally point to bullish fatigue in what has been an impressive rally at a time when interest rates have risen faster than any time in recent history. Looking at the chart, yesterday’s daily candle managed to trade ever so slightly higher than last Wednesday’s high, easing towards the close of trade. Furthermore the RSI reveals another dip into overbought territory, while the MACD signals a potential shift in momentum towards the downside as the MACD line threatens to cross below the signal line.
In the event bullish momentum is fading, levels to watch for a pullback appear via the 4500 psychological level as the RSI re-enters overbought territory. However, the long-term trend still points higher unless the chart tells a different story. Therefore, bulls will be eying further upside of 4637 and seeing that the index is merely 5% from the all-time high, a serious move in that direction is not off the table, especially if the Fed appear to be dovish in their stance on monetary policy. Essentially, the Fed have the power to influence US stocks in either direction based on their collective decision and communication of current and possibly future assessments of the economy and appropriate policy.
S&P 500 Daily Chart

Source: TradingView, prepared by Richard Snow
Recommended by Richard Snow
Get Your Free Top Trading Opportunities Forecast
Tech-Heavy Nasdaq Eases Ahead of FOMC
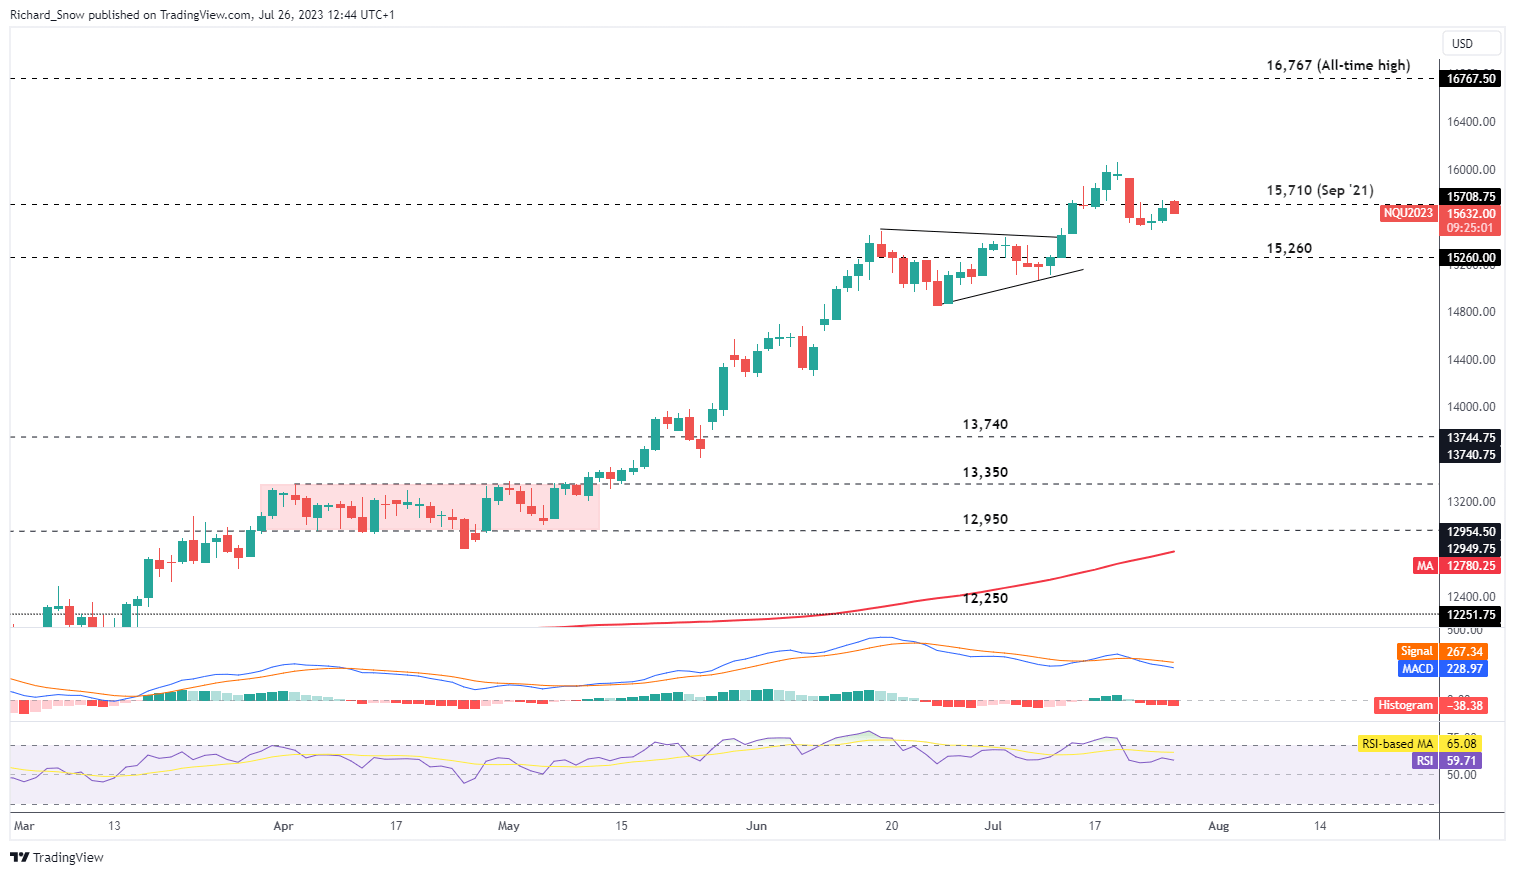
The Nasdaq pulled back on Thursday last week and has thus far struggled to trade towards the recent swing high. However, with a monumental week of big tech earnings reports due and three major central bank meetings, a surge in volatility may propel the index back to the swing high – especially if Meta results beat estimates and issues a positive outlook for Q3.
With the index expected to open lower in the US, 15,710 appears as the imminent level of resistance if the pullback is to extend towards 15,260. A hawkish Fed tone could bring about such a scenario or even broad support for another 25 basis point hike at some point during the rest of the year as this is not fully priced in yet.
Bullish continuation can be assessed on a daily close above 15,710, possibly followed by the swing high of 16,062. Thus far, the longer-term bullish trend has favoured a dip buying approach but with massive tech earnings and the FOMC on the radar this week, it may be prudent to wait for the dust to settle on this one before attempting to map out the short-medium term direction.
Nasdaq (E-Mini Futures) Daily Chart

Source: TradingView, prepared by Richard Snow
Trade Smarter – Sign up for the DailyFX Newsletter
Stay up to date with news and moves via our newsletter
Subscribe to Newsletter
— Written by Richard Snow for DailyFX.com
Contact and follow Richard on Twitter: @RichardSnowFX
 آموزش مجازی مدیریت عالی حرفه ای کسب و کار Post DBA آموزش مجازی مدیریت عالی حرفه ای کسب و کار Post DBA+ مدرک معتبر قابل ترجمه رسمی با مهر دادگستری و وزارت امور خارجه |  آموزش مجازی مدیریت عالی و حرفه ای کسب و کار DBA آموزش مجازی مدیریت عالی و حرفه ای کسب و کار DBA+ مدرک معتبر قابل ترجمه رسمی با مهر دادگستری و وزارت امور خارجه |  آموزش مجازی مدیریت کسب و کار MBA آموزش مجازی مدیریت کسب و کار MBA+ مدرک معتبر قابل ترجمه رسمی با مهر دادگستری و وزارت امور خارجه |
 مدیریت حرفه ای کافی شاپ |  حقوقدان خبره |  سرآشپز حرفه ای |
 آموزش مجازی تعمیرات موبایل آموزش مجازی تعمیرات موبایل |  آموزش مجازی ICDL مهارت های رایانه کار درجه یک و دو |  آموزش مجازی کارشناس معاملات املاک_ مشاور املاک آموزش مجازی کارشناس معاملات املاک_ مشاور املاک |
- نظرات ارسال شده توسط شما، پس از تایید توسط مدیران سایت منتشر خواهد شد.
- نظراتی که حاوی تهمت یا افترا باشد منتشر نخواهد شد.
- نظراتی که به غیر از زبان فارسی یا غیر مرتبط با خبر باشد منتشر نخواهد شد.


ارسال نظر شما
مجموع نظرات : 0 در انتظار بررسی : 0 انتشار یافته : ۰